Understanding Markets and Customers
The Value of Research
Marketing research is the process of gathering data about the product, customers and influences on the sales of the product. It then analyses the data to help make decisions.
Good research:
- Reduces the risk of making a poor decision.
- Helps businesses reach customers before their rivals.
- Helps a market-led business identify their customers’ needs.
But:
- Research takes time and resources.
- It also depends on how well it’s interpreted.
- Plus, conditions might change from the time that the research is done to the moment the product is on the market.
Primary Research
Fresh research carried out specifically for the business, either by the business or by an external source.
Examples of primary market research are:
- Surveys/questionnaires
- Focus groups
- Observations
Pros
- Specific to the business.
- Meets precise needs of the business.
- Can discover information that no other business has access to.
Cons
- Needs specialist knowledge to set up and carry out.
- Can be expensive.
- Often time-consuming.
- May not be comprehensive enough to make an informed decision – not enough information.
Secondary Research
Research which uses data that has already been collected.
Pros
- Cheaper.
- Quick to access.
Cons
- Not always in the format that the business wants.
- Available to competitors.
- May only partially answer the specific questions.
Using Research
The research can gather either quantitative or qualitative data.
- Quantitative data: numbers, like how many customers prefer one product over another.
- Qualitative data: opinions and motives, like why the customers prefer the product.
Businesses like to use both because:
- Quantitative data can be analysed and put into models. It’s also key for helping to put together budgets and proposals. Comparing figures is easier than comparing opinions.
- Qualitative data can give an insight into the product or business which isn’t quantifiable.
Calculations


Market Research v Marketing Research
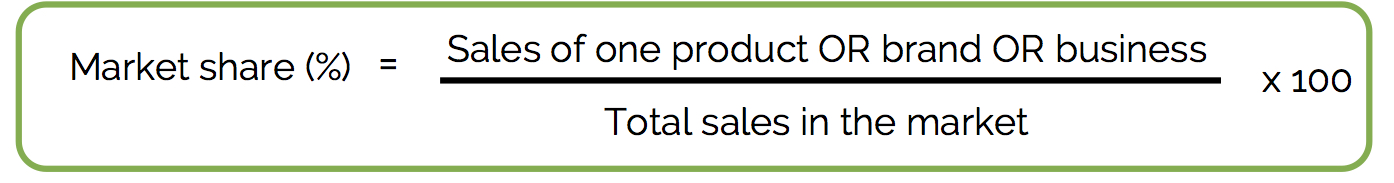
Market research looks at data within a specific market, like market size or competition.
Marketing research looks at data that will be used to influence the marketing. Therefore, market research is part of marketing research.
Market Mapping
Market mapping illustrates the position of products relative to other products in the market.
It takes two criteria, each with a range. For example, price (high/low), age of customers (young/old), features of product (hi-tech/low-tech).
Businesses use market mapping to:
- Assess product position to help make decisions on the direction of their marketing mix.
- Assess how to adjust other strategies, for example operational management of quality.
- Essentially to see how to beat the competition to gain more sales.
Value of Sampling
Sampling is gathering data and opinions from a small section of a total group. It saves time and money by only asking, say, 1% of the total group, as long as the sample is thought to represent the opinions of the whole group.
Examples of sampling are:
- __Quota __– a specific number of a certain definable group to be asked. E.g. 100 people who wear glasses. Might then be stratified.
- Random – any person has an equal chance of being asked.
- Stratified – certain percentages assigned to groups within the total group are asked. E.g. 50% males, 20% under the age of 18, 40% between 18 and 50, 40% over 50.
Advantages of sampling
- Saves time. A quicker answer can lead to a product being launched or adjusted before the competition makes their move.
- Saves money by not going through the process of asking the whole the group, which may be impractical anyway.
But
- Might be biased – the questions might be incorrectly formulated or not be collated properly.
- Sample size might be too small.
The Interpretation of Marketing Data
Businesses interpret marketing data by looking for trends, connections, patterns and gaps.
Correlation
Correlation analysis sees if there is a connection between two sets of information.
A positive correlation shows that an increase in the size of one factor links to an increase in the size of another. For example, an increase in spending on advertising might lead to an increase in sales.
A negative correlation shows that a decrease in the size of one factor links to an increase in the size of another. For example, a decrease in price might lead to an increase in sales.
The stronger the relationship the further the correlation coefficient (the number generated by the analysis is away from__ 0 and closer to __1
-1 Perfect negative correlation
0 no correlation
1 Perfect positive correlation
However, it doesn’t mean there’s a cause and effect. In other words, the figures might not be linked, just increase (or decrease) at the same time by chance. It might be that the change in one has a very small effect, but something else not examined has had the major effect. For example, sales might increase because advertising has increased, but in fact might mainly be because a competitor has left the market.
Confidence Levels
Confidence levels are used to decide how representative the researchers believe the data to be.
For example, if they estimate future sales to be between £12m and £13m in the next quarter, and they are 95% confident of that, then they think 19 out of 20 times, this will be the case. If they made the estimate narrower, say between £12.4m and £12.7m, then the confidence level might be 80%.
Extrapolation
Extrapolation is a method of predicting a possible future value. It’s done by looking at past trends and then estimating the outcome if that trend continues in the future.
The Value of Technology in Gathering and Analysing Data for Marketing Decision Making
Technology helps to gather and analyse data more effectively:
- Social media – a rich source of personal information and understanding brand awareness. It’s easier and quicker to reach certain target markets.
- Data collection – using software to ask more people more questions. Plus, every sale can be electronically recorded to understand buying patterns.
- __Enhanced data analysis __– more sophisticated and faster data analysis. It allows businesses to understand their customers more fully.
- __Larger pool of data __– that can be sifted through more quickly, giving more confidence in the potential outcomes.
Examples of technology being used:
- Mobile phone companies checking data usage by current customers to change their tariff packages.
- Amazon looking at items searched on their site to see which products to promote.
The Interpretation of Price and Income Elasticity of Demand Data
Elasticity means how sensitive something is to a change.
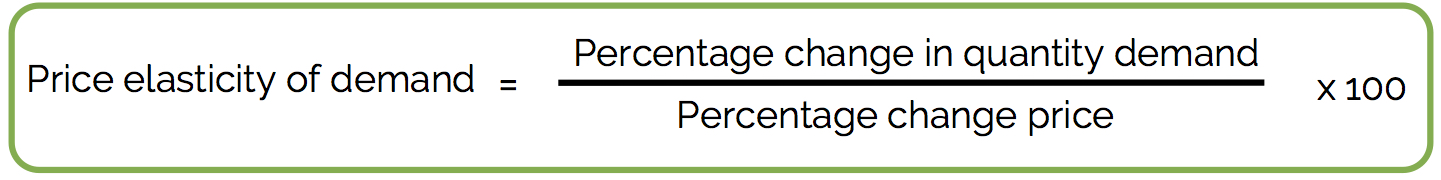
Price elasticity of the demand describes how sensitive demand for a product is to a change in the price of that product.
It’s calculated by:
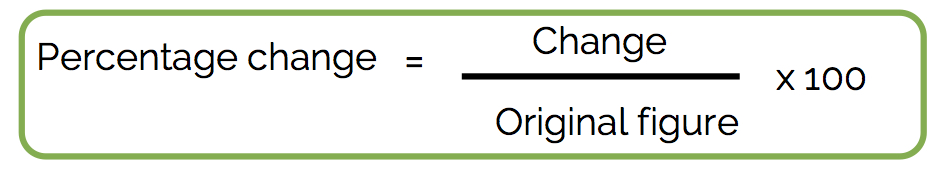
Percentage change is worked out by:
The result is always negative.
Interpreting the PED result
If the result is between -1 __and __0, it’s inelastic.
If the result is between –infinity and__ -1__, it’s elastic.
The more elastic, the closer the number is to – infinity.
If the product is elastic, then a fall in price will increase sales revenue.
If the product is inelastic, then an increase in price will increase sales revenue.
It’s guaranteed that you will use this concept in the exam at some stage__. __Think whether the product that the business is selling is elastic or inelastic.
Influences and limitations for PED
The elasticity of demand is made more inelastic:
- If the product has a strong brand image
- If the product is low percentage of a typical customer’s income
- If a customer takes less time to choose the product
- If there are few close substitutes for the product.
Or BITS (brand, income, time, substitutes)
PED has limitations because it is very difficult for a business to work out a product’s __PED __since it’s unlikely to change the price too often. It also won’t be able to work out whether any changes in demand have been caused by changes in the price, or by other factors, like changes in customers’ tastes or prices of substitute products.
Calculating income elasticity of demand
Income elasticity of demand describes how sensitive demand for a product is to a change in the income of a typical customer
It’s calculated by:
If the figure is less than 0, then it’s known as an inferior good. In other words, as customers earn more money, they will stop buying this product and move to higher quality products.
If the figure is between 0 and__ 1__, it’s an inelastic good, less sensitive to changes in incomes.
If the figure is above 1, it’s an elastic good, so more sensitive to changes in incomes.
It’s almost impossible for firms to calculate their income elasticity of demand. However, it can give an indication of whether the product will do well in the current economic climate.
The Value of the Concepts of Price and Income Elasticity of Demand in Marketing Decision Making
Price elasticity of demand:
- Pricing decisions – for example, a business might increase the price of more inelastic products.
- Output decisions – plan how much to increase output if dropping the price.
- Marketing mix decisions to make it more price inelastic, for example through an advertising campaign.
Income elasticity of demand
It has very limited value because it’s almost impossible to calculate. However, if you consider or feel instintively that your good is income elastic or inferior, you could be looking at the government data on future incomes to decide on production decisions or launching or developing new products.
The Use of Data in Marketing Decision Making and Planning
Good data is accurate and up-to-date. It helps make better decisions.
It’s part of the scientific decision-making model
Set objectives – gather data – analyse data – select – implement – review.
However, the business needs to take into account non-quantifiable ideas, such as customers’ feelings and a sense of where the market might be going (growth or innovations, for example).
Definitions
| Primary research | First-hand research, gathering information directly from consumers | |
| Secondary research | Research that has already been carried out or published by another firm | |
| Sampling | Sampling is the process of taking and analysing a smaller group of a whole population | |
| Quantitative data | Research based on numbers | |
| Qualitative data | Research based on opinions and attitudes | |
| Market mapping | A grid that shows two different aspects of the products or brands within a market | |
| Correlation | How closely related two sets of data are | |
| Confidence levels | The degree to which the statistics are a reliable predictor of an outcome | |
| Extrapolation | Predicting future values based on past data | |
| Price elasticity of demand | The responsiveness of a change in demand of a product to a change in price | |
| Income elasticity of demand | The responsiveness of a change in demand of a product to a change in income |
- What’s the key reason that a business uses marketing research?
- risk
- What are the two opportunity costs of marketing research?
- Your answer should include: benefit / foregone / time / resources
- Fill in the blanks: Market mapping illustrates the ____ of products ______ to other products in the market.
- Your answer should include: position / relative
- Research tells a business that total sales in the market were £1.2m in 2015 and the business made £240,000 in sales revenue. What was its market share for 2015?
- 0.2
- Which type of sampling is described as certain percentages assigned to groups within the total group are asked?
- stratified
- After gathering data, it is discovered that there is a correlation co-efficient of 0.87 between advertising on local radio and telephone enquires on the day after the advert is played. The correlation can be described as what?
- Your answer should include: positive / strong
- A business finds that it’s sales volume have gone up by 5% when it drops its price by 2%. What is its price elasticity of demand?
- -2.5
- The price elasticity of demand for a business is inelastic. If it wants to increase revenue, it should drop or increase prices?
- increase
- Exam Style QuestionA-level Paper 1, 2017A cafe sells two types of hot drinks. These drinks have the following income elasticities of demand:Coffee +2.0Tea -0.5The volume of coffee sales is several times greater than the volume of tea sales.Based on the information above, analyse how the cafe’s overall sales volume of hot drinks would be affected by a rise in consumers’ incomes. Assume there are no other changes. [9 marks]
- Your answer should include: inferior / normal / sales / quantity / demanded
Explanation: This is a 9 mark question. You would spend around 10 minutes in the exam on this. You should make between two and three key points and then apply them to this particular business. Analysis means showing how a key point impacts on a business. It gives the causes and the effects. You will be using terms like: because, so, therefore and means. In this question, consider what the two figures mean, thinking about the definition of elasticity and what positive and negative mean. Also, think about the relative sizes of the change in sales.