Materials
Bulk Properties of Solids
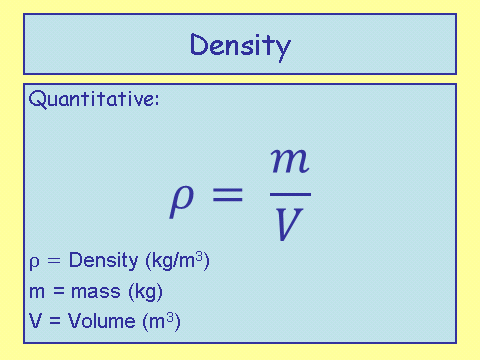
Density
Density is a measure of how much mass is compacted into a given volume. The density of an object is inversely proportional to the volume for a constant mass.
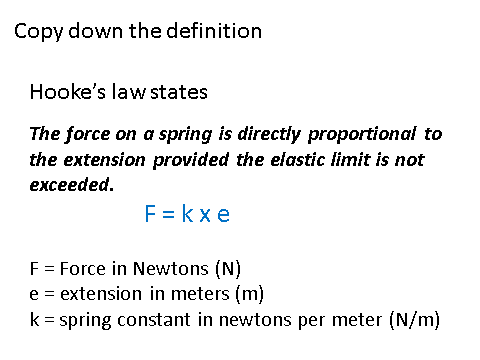
Hooke’s Law
The extension of an object, whilst elastically deforming, is directly proportional to the force applied - provided that the limit of proportionality is not exceeded.
The limit of proportionality is the point where the object no longer deforms elastically, and starts to deform inelastically.
This law is also known as Hooke’s Law.
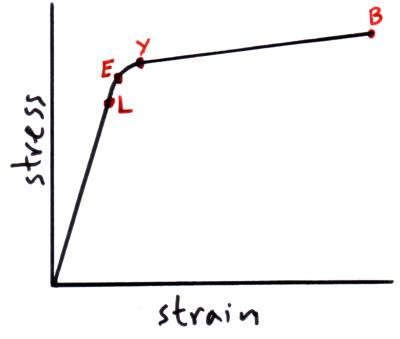
Stress and Strain
Tensile stress is a measure of a force acting over a given area.
The word tensile signifies that the object is under tension. The breaking stress or the ultimate tensile stress is the maximum amount of force a object can take before it snaps.
Strain is the ratio between the extension over the original length.
Inelastic Deformation
If an object behaves plastically, then inelastic deformation has occurred. This means that the object can no longer return to its original shape once the force applied has been removed.
When this happens an object might fracture and break.
Energy
The elastic strain energy is:
When the energy is released, it is transferred into kinetic and gravitational potential energy. This is due to the fact that it will ‘spring’ upwards, thus transforming energy into both of these stores.
Young’s Modulus
Young’s modulus is a measure of the tensile stress over the tensile strain:
Stress Strain Graphs
Let’s look at an exam question to see how young’s modulus fits in with interpreting stress-strain graphs.
A rubber cord is used to provide mechanical resistance when performing fitness exercises. A scientist decided to test the properties of the cord to find out how effective it was for this purpose. The graph of load against extension is shown in the figure below for a 0.50 m length of the cord.
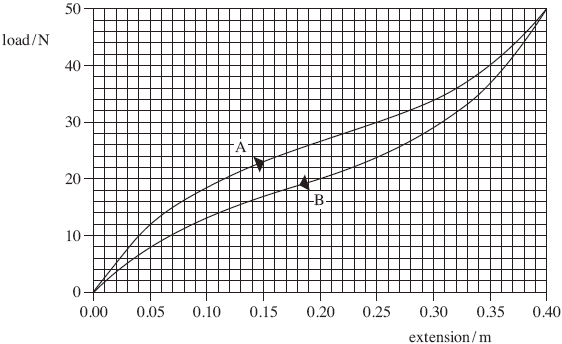
Curve A shows loading and curve B shows unloading of the cord.
(a) State which feature of this graph confirms that the rubber cord is elastic.
It returns to its original shape.
(1 mark)
(b) Explaining your method, use the graph (curve A) to estimate the work done in producing an extension of 0.30 m.
(12 to 14 big squares/318 small squares ± 8 area of 1 big square
= 10N × 0.05m = 0.50/small = 2 × 0.01 = 0.02)
statement of method that refers to area (1)
accept triangle if area is mentioned
5.0 to 8.0 (J) or clear attempt to calculate correct area (1)
triangle OK here 5.1 (J) for single triangle is max 2
answer = 6.0-7.0 J
(3 marks)
__(c) __Assuming that line A is linear up to an extension of 0.040 m, calculate the Young modulus of the rubber for small strains.
The cross-sectional area of the cord = 5.0 × 10⁻⁶ m2
The unstretched length of the cord = 0.50 m
(E =) (1)
(=) (1) also gets first mark
incorrect values of F and ΔL get first mark only
2.5 × 10⁷ (Pa) (1)
(3 marks)
(d) With reference to the spring, explain what is meant by limit of proportionality.
It is the point at which the graph is no longer linear.
(1 mark)
(Total 9 marks)