Interpreting Raw Environmental Data and Environmental Change
Using Quadrats and Transects
Studying the distribution of organisms within a habitat is important in order to understand the ecosystem.
__There are two ways to estimate the distribution of organisms within a habitat (that you need to know about: __
- Using quadrats - this is when you count how many organisms are in a small section of the habitat i order to estimate how many are in the whole habitat.
- Using transects - this is when you count how many organisms are along a line of the habitat in order to find out how the distribution of organisms changes across a habitat. For example, if beetles are more or less common when you move further away from a pond.
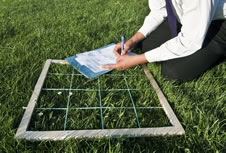
Using quadrats
A quadrat is just a square frame! They are usually 1m x 1m, but they come in lots of different sizes.
__Here is how to use one to estimate the population size of daisies in a field. The field is 60m wide and 50m long. __
- Work out the area of the field and write this down. Work out the area of the quadrat you are using and write this down.
- Throw the quadrat __randomly __in the field.
- Record how many daisies are inside the quadrat.
- Repeat steps 1-2 at least 3 more times (as many times as you can).
- Find the mean number of daisies by calculating an average. This is done by adding all the counted daisies together and dividing by how many times you threw the quadrat.
- Now work out how many quadrats can fit into the field by dividing the area of the field by the area of the quadrat. This is done by dividing the field area by the quadrat area.
- Multiply the average number of daisies by how many quadrats fit into the field. This will give you an average of how many daisies are in the whole field.
- If you had counted the following:

Then this would be what your working should look like:
Field area = 60m x 50m = 3000㎡
Quadrat area = 1m x 1m = 1㎡
Average number of daisies = (23 + 25 + 20 ) 3 = 22.6 daisies on average
Number of quadrats that fit into the field = 3000㎡ ÷ 1㎡= 3000 quadrats
Average number of daisies in the whole field =3000 x 22.6 daisies = 68000 daisies
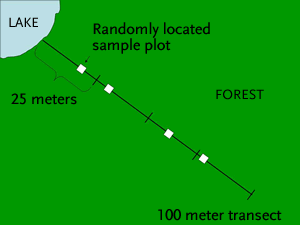
How to use a transect
__To use a transect: __
- Mark out a line with a tape measure of the area you want to study. For example, the area going from a lake and into the forest.
- Collect data of the organisms that are near the line. You can do this by only counting the organisms that touch the tape, or you can use quadrats along the tape in intervals (i.e every 3 metres).
- Remember to record the place the organism was found, for example, 10m from the lake.
Percentage cover
If it is difficult to count the number of organisms in a quadrat (for example, you wouldn’t want to count all the blades of grass), then you can use percentage cover instead!
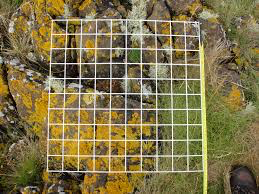
This is done by counting how many squares in the quadrat have the organisms in and working out a percentage.
In the picture above, grass is in about 19 squares out of 100. This means that there is grass in about 19% of the quadrat!
Environmental Change
Environmental changes can cause the distribution of organisms to change.
Examples of environmental changes are:
- Temperature - for example, rises in temperature may attract new predators to a habitat
- Water availability - for example, Lakes may dry up, decreasing water life or organisms may not be able to get enough to drink and may die.
- Changes in the air concentration - for example, if there is more sulfur in the air, some species may die through sulfur poisoning
- __pH of soil __- for example, some plants may die due to the change in soil pH.
Remember, more often than not, a change in any abiotic or biotic factors result in a change in the ecosystem since animals/plants all depend on each other.
The Cycling of Materials
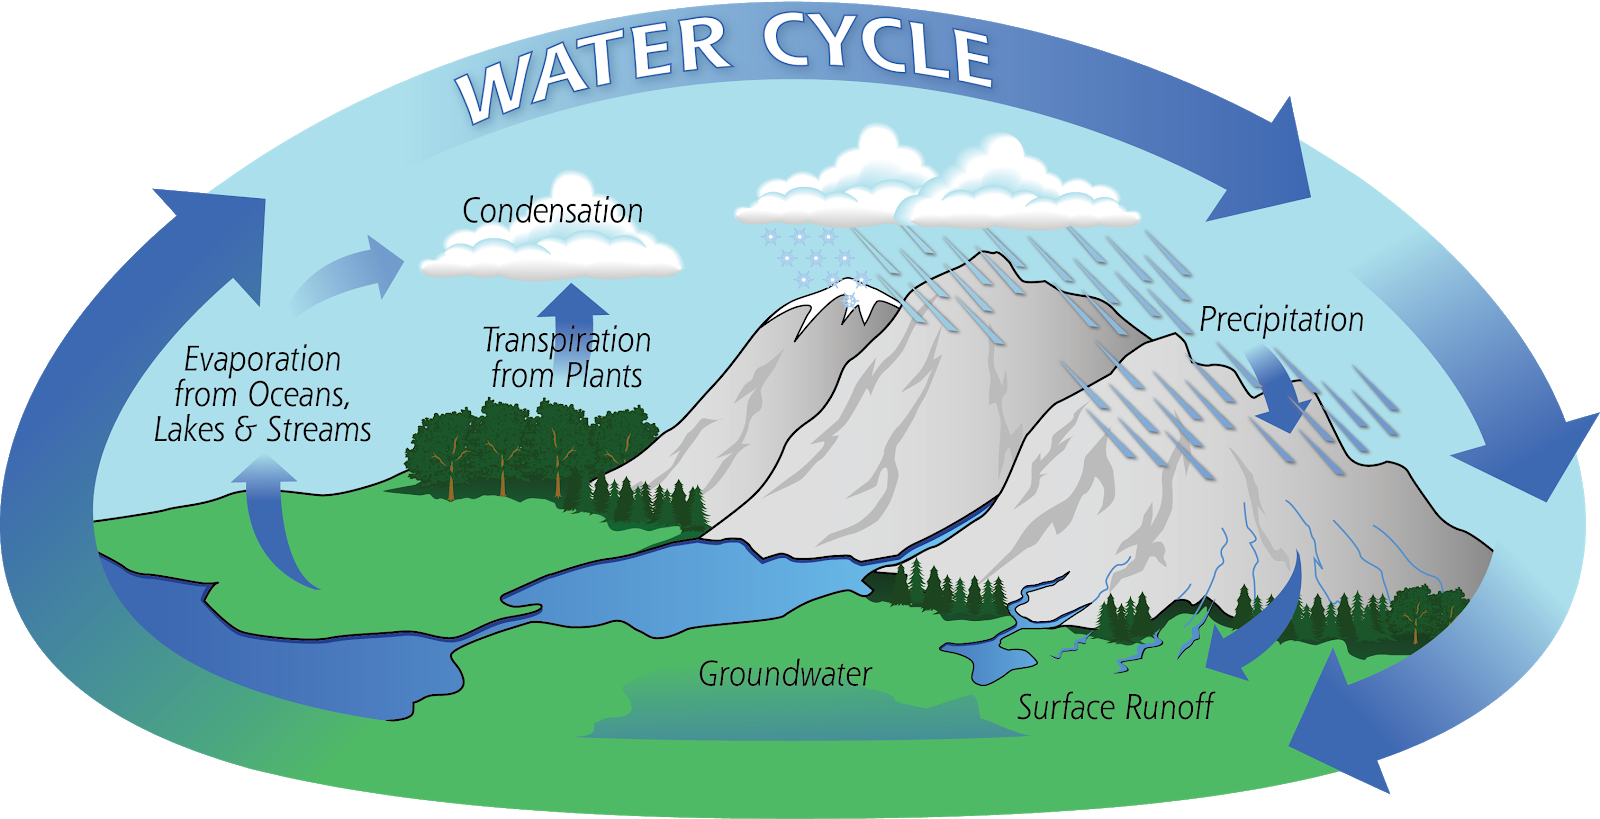
The Water Cycle
Water is constantly recycled! Fresh water falls from the sky, as rain, snow or hail It then runs off into lakes, rivers and seas It is drank by animals and taken up by plants. It then evaporates from the land and plants (transpiration, see the transpiration section) into the sky. The cycle then starts all over again!
Recycling of elements
All things are made out of materials that they take from the world around them. When living things take in food and water, they turn this into things like cells and proteins. These materials can be put back into the earth through waste or when the organism dies, it decomposes, releasing the materials back into the earth.

Try and guess why this art piece is relevant to the recycling of elements!
Carbon cycle
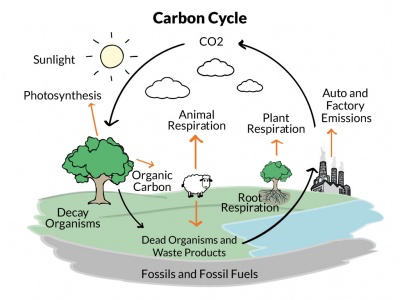
Carbon is constantly being recycled too. All living matter is made of carbon.
- Carbon is taken from the air by plants and algae. The carbon is used to make glucose, carbohydrates, fats and proteins for the plants
- The plants are eaten by animals or their dead remains are eaten by microorganisms.
- The carbon moves through the food chain and is returned to the air through respiration of plants and animals. It also returns to the air through the burning of wood and fossil fuels.
Decay
Decay is actually just when bacteria, funghi or detritus feeders feed on the remains of dead organisms. They need the right conditions in order to survive and decay organic matter.
Temperature
The temperature needs to be just right for the decomposers. If it is too high, their enzymes will denature and the decomposers can’t decompose matter at all. If the temperatures are too low (for example, in ice) the enxymes don work well enough so they can’t decompose. This is why we sometimes find preserved fossils from millions of years ago in ice!
Oxygen availability
Some decomposers need oxygen to survive since they respire aerobically (see aerobicRespiration section). However, some respire anaerobically so they don’t need oxygen to survive. These microorganisms are said to contribute to anaerobic decay.
Water availability
Decay happens faster in moist environments. This is because decomposers need water to survive.
Amount of decomposers at the scene
Decay happens faster when there are more decomposers present. This is because there are more decomposers to feed on the dead organism.
Compost
Compost is used by gardeners to help their plants grow. Compost is just made out of decomposed organic matter. When compost is put in the soil with the plants, the plants can take up all the nutrients from the compost.
Biogas
When decomposers decay organic matter anaerobically (without oxygen), they give out gas as a waste product. This gas is called biogas. Biogas is made mostly out of methane gas.
Biogas can be burned as a fuel. It can be made on a huge scale by using the waste from sewage works or sugar factories (etc). Biogas cannot be stored as a liquid so it needs to be used straight away.
Biogas generators come in 2 forms:
Batch generators
Produce batches of biogas
Waste is put in and given time to digest
The biogas that is produced is collected at the end of each session.
Does’t need to be continuously topped up with waste
Doesn’t produce biogas at a steady rate
__Continuous generators __
Produces biogas continuously
Needs a continuous supply of waste
These are more suited to large scale productions of biogas
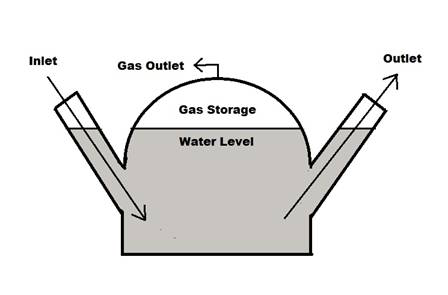
Both forms of biogas production need the following:
- An inlet for waste material
- And outlet for digested material to be removed
- An outlet for biogas to removed for use.