Consumer and Producer Surplus
Consumer Surplus
Fig 1 represents the market demand for a good where the current market price is £10, so the actual quantity consumed is 6 units:
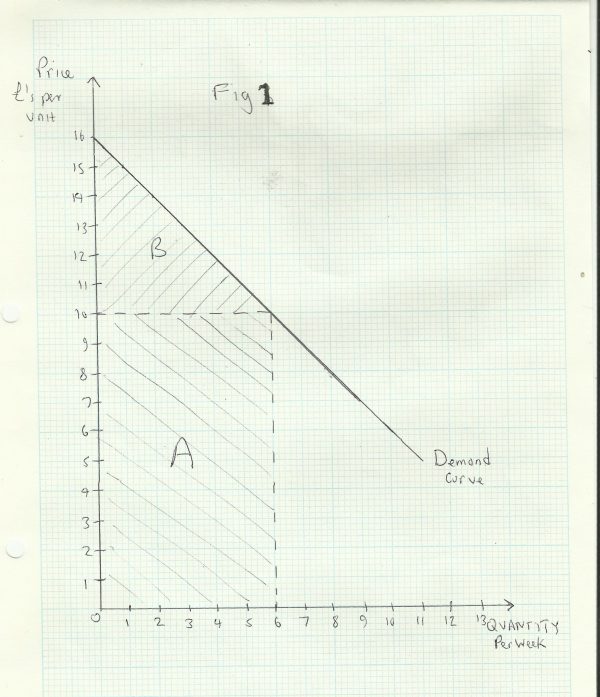
The consumer’s total expenditure would therefore be £60, shown by area __A __in _Fig 1. _But the the value of the consumer’s total utility is actually £75. This is equal to the sum of the marginal utilities of each successive unit (£15+£14+£13+£12+£11+£10).
The consumer’s total utility is equal to what she would have been prepared to pay (£75) if she had to negotiate the purchase of each unit separately. This is shown by area A+B. In fact she can buy them all at the same price (£10).
The difference between what the consumer actually spends, and what they would have been prepared to spend is called consumer surplus. This is shown by area B.
How the Surpluses are Shared Between Consumers and Producers
The main determinant of the relative sizes of consumer surplus and producer surplus is the relative elasticities of demand and supply. Consider Fig 3 below:
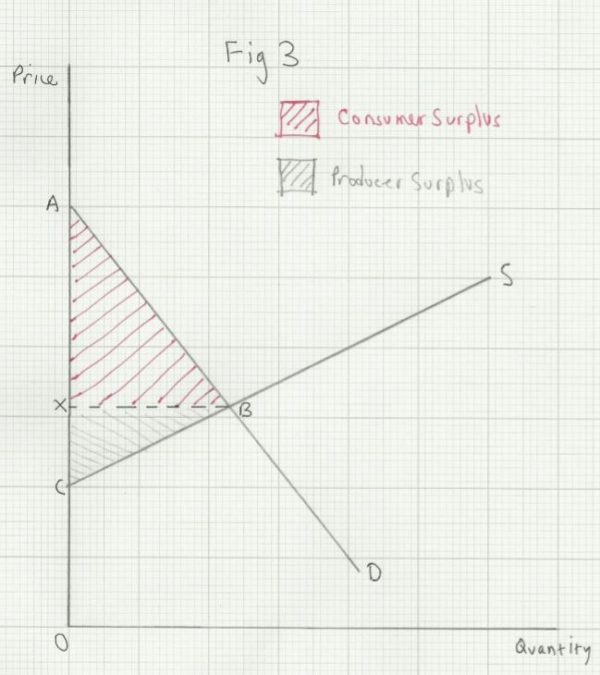
You can see that consumer surplus (area ABX) is greater than producer surplus (area CBX). This is because demand is relatively inelastic compared to supply. If supply was more inelastic than demand (shown by a shallow sloping demand curve and steeply sloping supply curve), producer surplus would be greater than consumer surplus.
You will see in Theme 3 that market structure greatly affects the relative sizes of consumer and producer surpluses. The more market power producers have, the smaller the amount of consumer surplus and the greater the amount of producer surplus. This in turn depends on the extent of competition in the market.
Producer Surplus
An upward sloping supply curve shows that more will be supplied the higher the price. In Fig 2, for instance, 1000 units will be supplied at a price of £4, but 4000 will be supplied at a price of £10.
Suppose the actual market price is £10. The total revenue received by producers would be £40,000 (£10 X 4000). This is shown in Fig 2 by the sum of areas A+B:
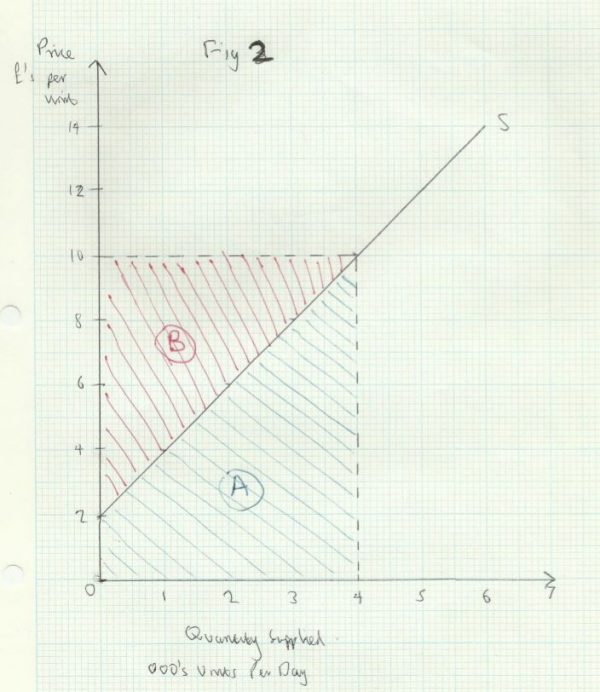
But some producers would accept a lower price. For instance 1000 units would be supplied at a price of £4. Those producers therefore receive more revenue than they would have been prepared to accept. This is called producer surplus and is defined as the difference between the total revenue producers receive and what they would have been prepared to accept. It is shown by area B.
Changes in Consumer and Producer Surplus
A change in the conditions of demand or supply will affect the size of both consumer surplus and producer surplus.
Firstly, let us consider the effect of changes in the conditions of demand. This is shown in _Fig 4 _below:
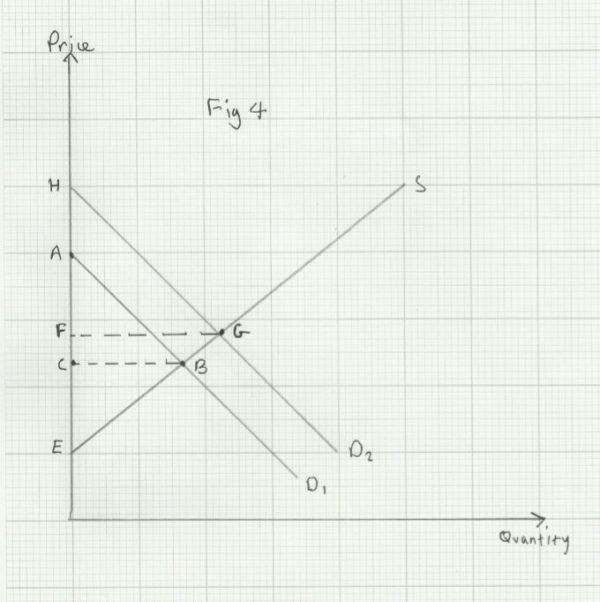
An increase in demand from D1 __to D2 shifts the market equilibrium from point __B to G. This results in an increase in producer surplus from area CBE __to area __FGE.
Consumer surplus is also increased, from area ABC __to area __HGF.
A decrease in demand from __D2 __to __D1 __would result in a fall in both producer surplus and consumer surplus.
Secondly, consider the effects of changes in the conditions of supply, as shown in Fig 5 below:
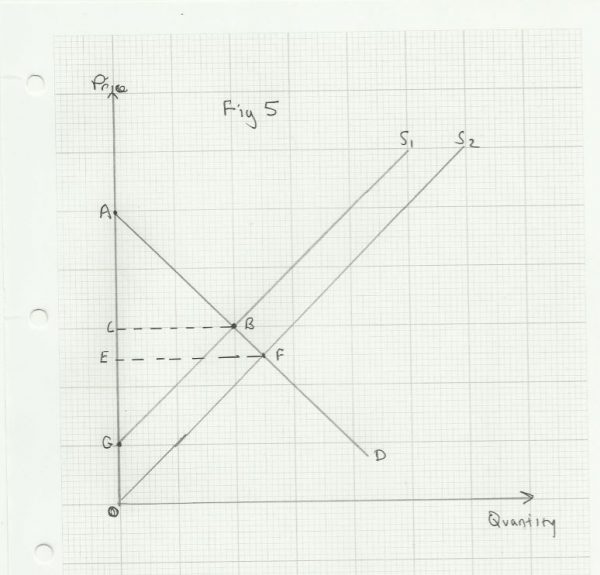
An increase in supply from S1 __to __S2 __shifts the market equilibrium from point __B __to __F. This results in an increase in producer surplus from area CBG to area EFO.
Consumer surplus is also increased, from area ABC __to area __AFE.
A decrease in supply from __S2 __to __S1 __would result in a fall in both producer surplus and consumer surplus.