Supply
Definition of Supply
In a market, supply refers to the quantity that producers are willing and able to sell at any given price in a given time period.
For the vast majority of goods, there is a direct relationship between quantity supplied and price; producers are willing to sell more at a higher price and vice versa, ceterus paribus (provided that nothing other than price changes). This is because producers can make more profit at higher prices and new producers will enter the market as price rises.
Consider Table 1 below, called a ‘supply schedule’ for milk:
| Price (£ per litre) | Quantity Supplied (millions of litres per day) |
| 2 | 6 |
| 1.8 | 5 |
| 1.6 | 4 |
| 1.4 | 3 |
| 1.2 | 2 |
| 1 | 1 |
We can plot this data on a two dimensional graph, in Fig 1 below:
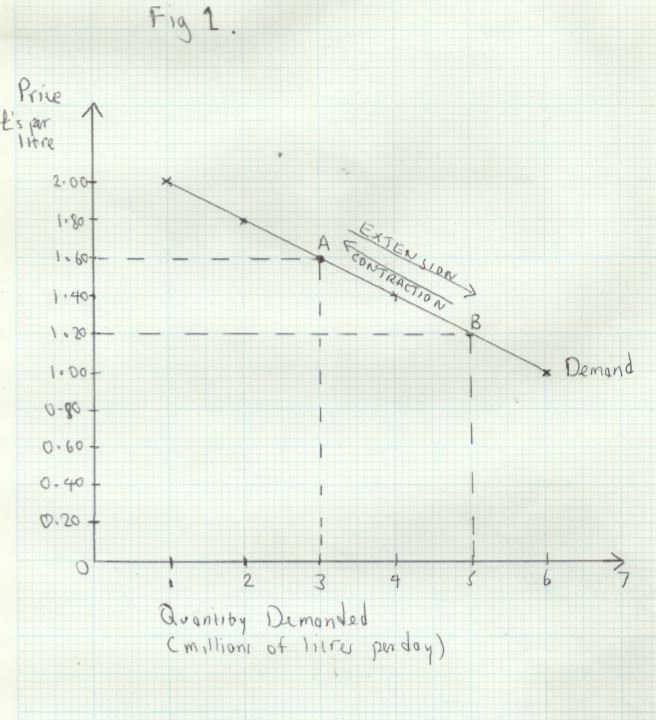
The line plotting the quantity supplied against price is called the ‘supply curve’. It shows the quantity demanded at each price. For instance, at point __A __price and quantity are respectively £1.20 and 2 million.
If price rises to £1.60, supply goes up to 4 million. This is shown at point B. This movement along the supply curve from A __to __B __is called an extension of supply. Correspondingly, a fall in price such as the movement from __B __to A __is called a contraction of supply.
Changes in the Conditions of Supply
The supply schedule and supply curve reflect the _ceterus paribus _assumption, that quantity supplied is changing only in response to a change in price. In the real world there are many other influences on supply, and these may cause the supply curve to shift outwards to the right, or inwards, to the left. These changes are called respectively increases/decreases in supply__.__
Look again at _Table 1. _Suppose there has been a fall in the cost of cattle feed. This would result in more milk being supplied at each price as farmers will now make more profit. Let’s suppose that supply increases by 1 million litres at each price. The effect of this increase in supply is shown in _Fig 2 _below:
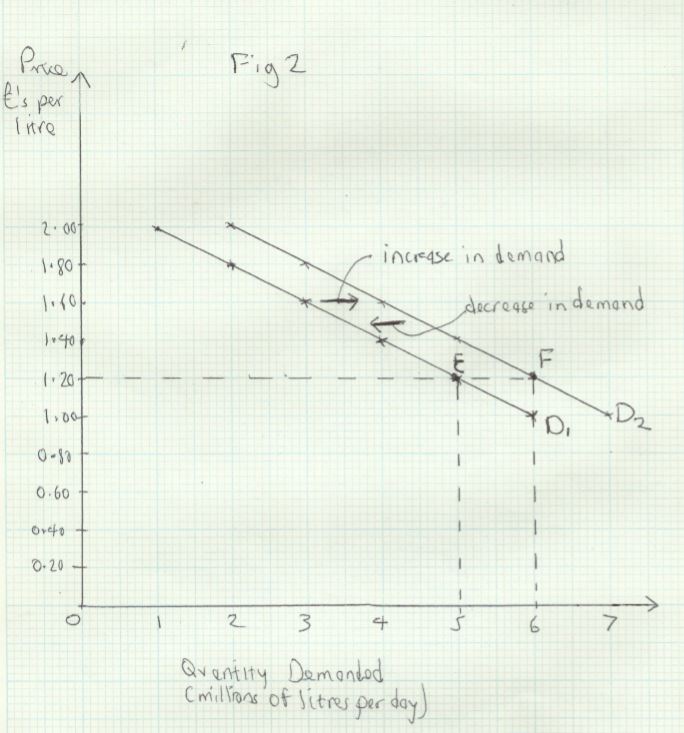
We can see that the increase in supply shifts the supply curve from S1 __to __S2. Before the fall in cattle feed costs, the quantity supplied at a price of £1.40 was 3 million. Now it is 4 million. This is shown by the movement from point C to point D. Similarly, at all other prices, supply has increased by 1 million litres. Conversely, a shift from point__ D to __C would represent a decrease in supply.
All the factors that influence supply apart from price are called the conditions of supply. A change in any of these conditions results in an increase/decrease in supply. The main conditions of supply are:
- Changes in costs of production - for instance a fall in wages or raw material prices will lead to an increase in supply
- Taxes or subsidies - a tax levied on the sale of the good will result in a decrease in supply and a subsidy will cause an increase in supply
- Changes in the prices of other goods - for goods that are in joint supply__, __an increase in the supply of one good, following a rise in its price, will cause an increase in the supply of the jointly supplied good. For example a rise in the price of milk will result in bigger dairy herds, resulting in an increase in the supply of cowhides for leather. For goods in competitive supply, such as wheat and barley, an increase in the price of wheat would result in a decrease in the supply of barley
- Changesintechnology - in the long term this is one of the main drivers of supply. Automation, for instance has greatly increased the output of many manufacturing processes
- Environmental conditions - natural disasters like earthquakes or floods can have short term efects on supply. Climatic change may affect some industries (i.e. farming) over a longer timescale
- Government policy - legislation to restrict or allow the production of some goods and services can be important. For example, from 2040 there will be no new petrol or diesel cars on sale in the UK
- Collusion by producers - in some industries, producers can agree collectively to reduce output in order to drive up price_. _Such arrangements are called cartels.
Producer Surplus
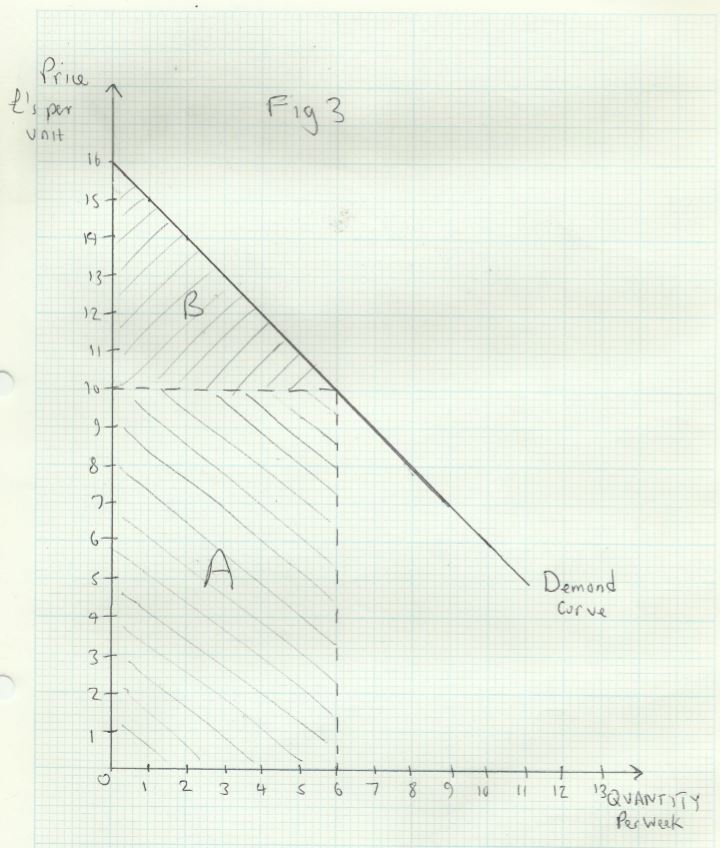
An upward sloping supply curve shows that more will be supplied the higher the price. In Fig 3, for instance, 1000 units will be supplied at a price of £4, but 4000 will be supplied at a price of £10.
Suppose the actual market price is £10. The total revenue received by producers would be £40,000 (£10 X 4000). This is shown on the diagram by the sum of areas A+B.
But some producers would accept a lower price. For instance 100 units would be supplied at a price of £4. Those producers therefore receive more revenue than they would have been prepared to accept. This is called producer surplus and is defined as the difference between the total revenue producers receive and what they would have been prepared to accept. It is shown by area B.