Trade Cycle
Trade Cycle
Economic growth does not proceed at an even rate over time. There are periods when GDP grows faster than its long term trend rate, whilst at other times it grows below the trend rate, or even falls (i.e. negative growth).
There tends to be a pattern to the way the economic growth fluctuates over time, consisting of a cycle of four stages. These are known as the trade cycle (also called the business cycle or__ economic cycle__).
The trade cycle is illustrated in Fig 1 below:
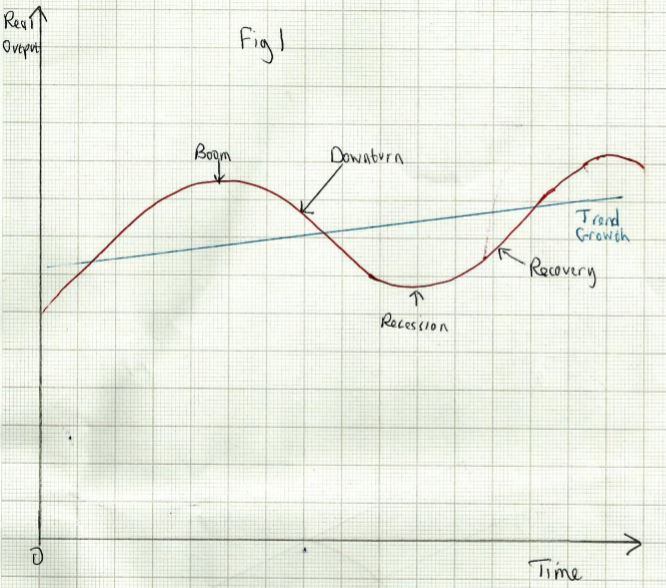
In a Boom:
- GDP is at the peak of the cycle, with growth significantly above the trend rate
- It is likely that there is a positive output gap. Unemployment is at its lowest
- Business and consumer confidence will be high and also investment and consumer spending will be strong too
- Wages, prices and profits will be growing strongly, so inflation will be at a peak
- The high level of spending will also mean higher imports, so it is possible that the current account of the balance of payments will be in deficit
- Government finances will probably show a __budget surplus __(T > G) as tax receipts rise and spending on unemployment benefits falls
In a Downturn:
- GDP starts to fall
- The output gap shrinks. Unemployment starts to rise
- There will be an increase in business failures (ceasing to trade)
- Business and consumer confidence fall, and investment and consumer spending slows down
- The rate of inflation slows down as wage growth and prices fall. Profits also fall as sales slow down
- The current account moves back towards a surplus as imports slow down
- Government finances worsen as tax receipts start to fall and spending on benefits rises.

In a Recession:
- The economy is at the bottom of the cycle, with GDP at its lowest point
- There is a significant negative output gap and unemployment reaches its highest level
- Business failures reach a peak
- Business and consumer confidence are at their weakest, and investment and consumer spending are low
- Inflation is at its lowest level, and may be negative (ie. prices actually falling)
- The current account is likely to be in surplus as imports are weak
- Government finances are in deficit (G>T) as tax receipts are at their lowest level and benefits at their maximum
In Recovery:
- GDP starts to grow again, slowly at first and then at an accelerating rate
- The negative output gap shrinks and unemployment starts to fall
- the number of business failures starts to fall
- business and consumer confidence start to improve; investment and consumer spending start to rise
- Inflation starts to pick up as wages recover. Profits also start to rise again
No two trade cycles are exactly alike, and the four stages above do not always happen in exactly the way described. Fig 1 shows a very strong cyclical upswing and then downswing, with very large output gaps in the boom and recession stages.
Many cycles are much shallower, with only mild fluctuations in output. Sometimes there is no actual fall in output, just a slowdown in the rate of growth, before it returns to the trend rate or just above. Since the second world war, governments have generally accepted an obligation to try to reduce the severity of the trade cycle by active demand management policies, but they don’t always succeed (the recession after the banking crisis in 2007/8 was particularly severe).
It is important to note the difference between a slowdown and a recession; the former means the economy is growing more slowly than before, or below trend. The latter means the economy is actually shrinking.
A Recession is generally defined as two successive quarters (ie six months) in which GDP growth has been negative (ie falling).
Causes of the Trade Cycle
The cyclical pattern can be triggered by demand side shocks or supply side shocks__. Shocks can be __positive __(causing the economy to grow faster) or negative __(causing a slowdown).
Demand side shocks include:
- a housing boom or crash (causing wealth effects)
- a stock market boom or crash (causing wealth effects)
- a recovery or slowdown in the world economy (affecting exports)
- interest rate changes (rising rates will reduce AD and vice versa)
- fiscal policy changes (rising taxes and cuts in public spending will reduce AD and vice versa)
Supply side shocks include:
- Changes in the prices of world commodities (i.e. a rise in oil prices will reduce SRAS and hence equilibrium output, and vice versa)
- Industrial disputes could lead to wage increases and cost push inflation, and vice versa.