Externalities
Externalities
Externalities are important because they can result in market failure and an inefficient allocation of resources.
Definitions:
__Externalities __result from the production or consumption of a good when the social costs are greater than the private costs or the social benefits are greater than the private benefits.
__Private costs __are the costs borne by the producers or consumers of a good. For instance, diesel used by a transport company is a private production cost; a payment by a patient to a clinic for a vaccination is a private consumption cost. Private costs are also sometimes called internal costs.
Private benefits are the benefits enjoyed by the producers or consumers of a good. Provided that the good is not subject to a tax or subsidy, it can be measured by the amount that consumers spend on the good (in a given time period). Private benefits are also sometimes called internal benefits.
External costs __(also called __negative externalities) are the costs borne by third parties who are neither the consumers or producers of the good. Both producers and consumers can create external costs. An example of an external production cost is the pollution of lakes and rivers caused by intensive use of fertilisers by farmers. The polluted water has to be treated before being supplied to homes. This raises everyone’s water bills.
An example of an external consumption cost is the cost to the health service of treating people with respiratory conditions as result of smoking, This raises everyone’s taxes.
External benefits __(also called positive externalities__) are the benefits or gain to third parties resulting from the production or consumption of a good. For example, HS2 (the proposed new high speed rail link between London and the north of England) will relieve overcrowding on existing train services, therefore benefiting rail passengers not travelling on the high speed route.
__Social costs __refer to all the costs incurred by the community arising from an economic activity, both private and external, summarised in the following equation:
Social Costs = Private(Internal) Costs + External Costs
__Social Benefits __refer to all the benefits to the community arising from an economic activity, both private and external, summarised in the following equation:
Social Benefits = Private (Internal) Benefits + External Benefits
Welfare Loss From Negative Production Externalities
_Fig 2 _below shows the market demand and supply for a good that creates a negative production externality, such as a power station burning coal, contributing to global warming and harmful particles that damage people’s health.
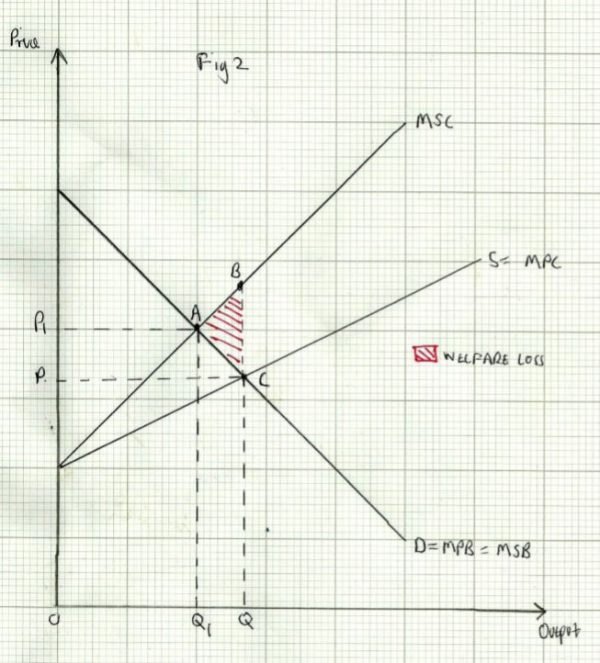
The supply curve __S __is also the mpc curve. But the external cost has to be added to derive themsc curve. The external cost on each successive unit of output is likely to increase (for instance, emissions from power stations only become a serious threat to health when they reach a certain level). The msc curve therefore diverges further from the mpc curve as output increases.
Assuming there are no consumption externalities, the demand curve also shows the mpb and msb.
We can now see that the privately optimal output is at OQ (where mpb=mpc), and the price is at OP. The socially optimal output, however is at__ OQ1, where msb=msc. And the socially optimal price is __OP1. The good is being over-produced by the quantity OQ minus OQ1. Each successive unit produced above OQ1 __adds increasingly to the welfare loss, as the gap between msc and msb widens. For instance, the __OQth unit creates a welfare loss of BC. The total welfare loss is represented by triangle ABC.
Socially and Privately Optimum Levels of Output
For the moment, let us assume that there are no external costs or benefits. Let us further assume that demand is shown by a normal, downward sloping demand curve, and supply is shown by a normal upward sloping supply curve, as in Fig 1 below.
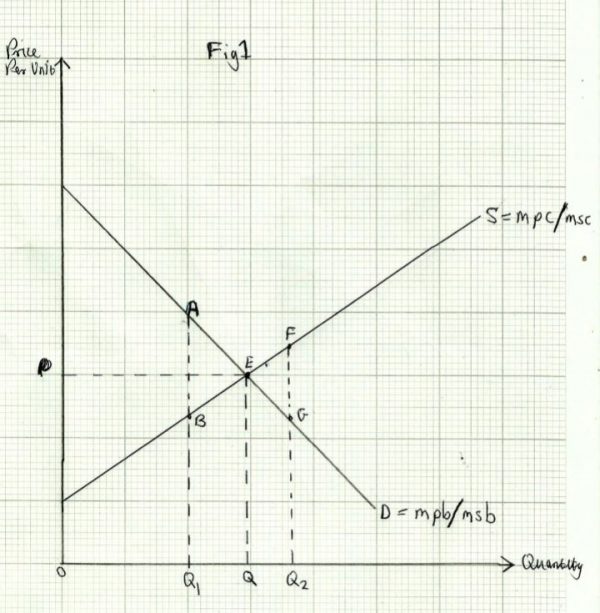
The market is in equilibrium at point E, where the the quantity demanded and supplied are both equal at OQ. This is also the privately optimal output, because the marginal private cost (mpc) is equal to the marginal private benefit.
This can be explained as follows:
The supply curve is upward sloping because as output rises, the marginal cost of production increases. Each additional unit costs more because producers experience diminishing returns. Producers also have to use resources which are less and less suitable as output rises. For instance, to increase output of wheat, farmers use the best land first and gradually bring into cultivation land that is less fertile if demand increases.
In Fig 1, at price__ OP__, the marginal unit at output __OQ, __is just worth producing, because the price covers the marginal private cost (mpc) to the producers. At any other price, supply will be at a level where price is equal to mpc. The supply curve is therefore the same as the mpc curve.
The demand curve slopes downward because of the law of diminishing marginal utility. The price consumers are prepared to pay to purchase any given quantity is a measure of the value they place on the last, or marginal unit. So price is therefore a measure of the marginal private benefit (mpb) to consumers. The demand curve is therefore the same as the mpb curve.
We can see from _Fig 1 _that at a level of output below market equilibrium, such as OQ1, the mpb at point A is greater than the mpc at point__ B__. At this output the good is being under-produced, as consumers are willing to pay more for additional units than the cost of producing them.
There is a potential welfare gain, shown by the triangle ABE, if output increases to OQ, since each additional unit between OQ1 and __OQ __creates more benefits than costs.
At any level of output above the equilibrium, such as OQ2, the good is being over-produced, since the mpc at point F __is greater than the mpb at point __G. The triangle EFG __represents a __welfare loss, as each additional unit between OQ __and __OQ2 creates more costs than benefits.
Remember that we have so far assumed there are no externalities, so marginal private cost and marginal social cost are equal. The same applies to mpb and msb. In_ Fig 1_ therefore, the output is at both the privately and socially optimal level.
The free market takes no account of external costs and benefits, as consumers and producers are only interested in private costs and benefits. This is why market failure can occur, because the socially optimum output differs from the privately optimal output when there are external costs or benefits:
Potential Welfare Gain From Positive Consumption Externalities
Fig 3 below shows the market demand and supply for a good that creates a positive consumption externality. A flu vaccination is a good example. It gives a private benefit to consumers who have the jab, as it protects their health, but also creates an external benefit to the rest of us, as we now have a reduced chance of catching flu. There may be benefits to the economy as well, as there is less absence from work.
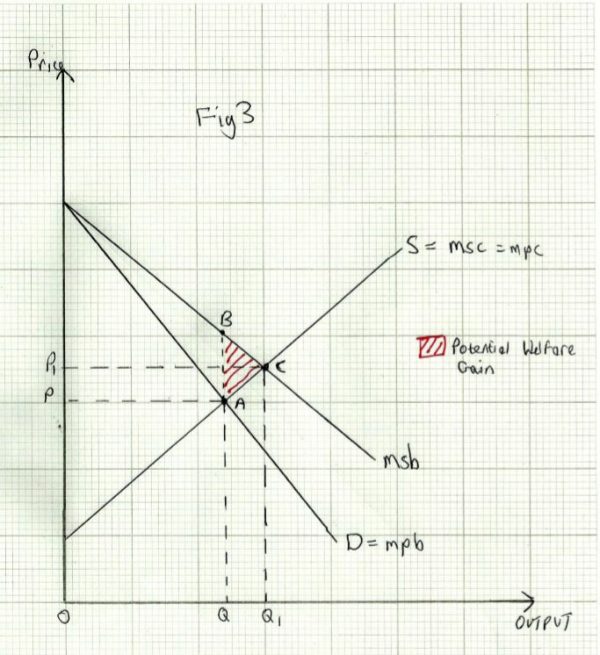
Assuming there are no production externalities, the supply curve S is a measure of the msc as well as mpc.
The demand curve D, measures the mpb but does not take account of the positive externality. The msb curve is therefore above the demand curve. At a high price it is likely that older and more vulnerable people will be willing to pay for a vaccination, as it has a high private benefit for those people. At a lower price, younger and fitter individuals may be willing to have the jab, generating a lower private benefit, but a higher external benefit, as they are more likely to be economically active. The msb curve therefore diverges from the mpb curve.
The privately optimal quantity of vaccinations is shown by OQ __and the socially optimal quantity is __OQ1. Triangle __ABC __represents the potential welfare gain if output is increased to the socially optimal level.