Output Gaps
Output Gaps
An output gap occurs whenever the actual level of GDP (real output) diverges from the potential or full capacity output of the economy (i.e. the output at full employment).
Another way of looking at this is that an output gap exists when the economy is not operating along its production possibility frontier (PPF).
Output gaps can be positive or negative; a positive output gap occurs when the economy is operating beyond its full capacity (this is likely to result in higher inflation, with the economy gradually returning to its normal full capacity output). It is operating outside (to the right) of its PPF.
A negative output gap exists when there is spare capacity (unemployment). The economy is inside its PPF.
Output gaps can be illustrated diagrammatically in three ways:
- A PPF diagram
- A trend growth diagram
- An AD/AS diagram
Trend Growth Diagram
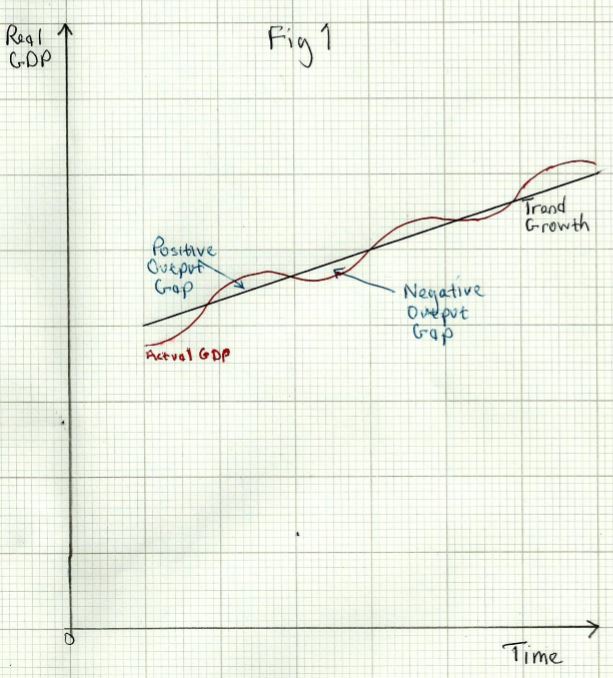
The straight black line shows the long term trend growth o the economy. In the UK the trend rate of growth is about 2.5%. Whenever the economy grows faster than this (as in a ‘boom’), the actual growth of GDP (shown by the red line), will be above trend, and hence there is a positive output gap.
When the economy grows below its trend rate (or when growth is negative, in a recession), there will be a negative output gap, and the red line is below the trend line.
AD / AS Diagrams
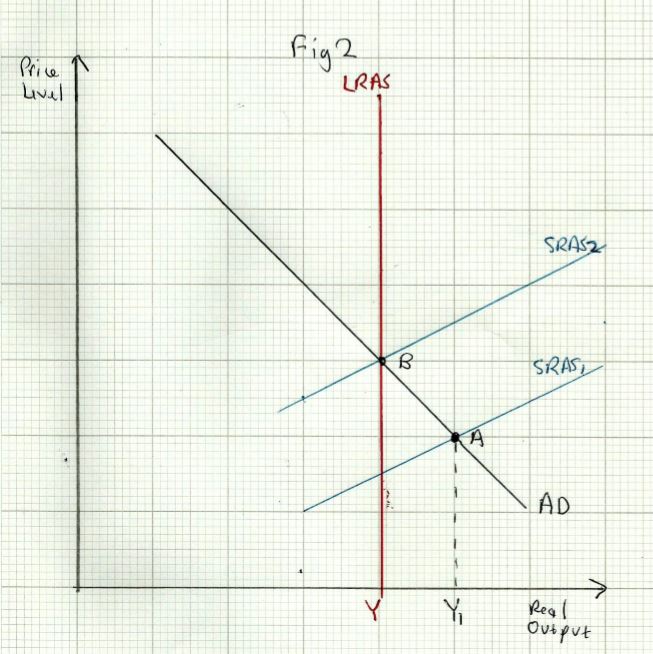
A positive output gap is shown in _Fig 2 _above. If the economy is in short run equilibrium at point A, there is a positive output gap (Y __to Y1). A shortage of labour and other inputs will raise factor prices, resulting in a shift of SRAS from SRAS1 to SRAS2. This will bring the economy back to long run equilibrium at point __B, but at a higher price level (higher inflation).
A negative output gap is shown in _Fig 3 _below:
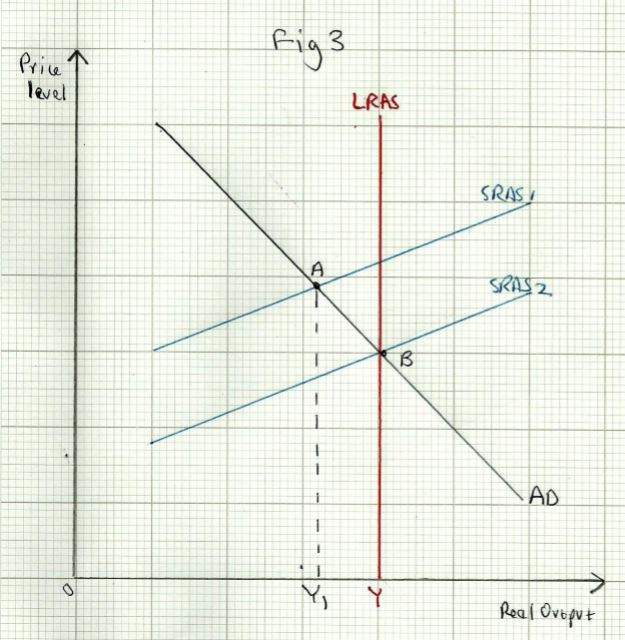
The economy is initially in short run equilibrium at point A. There is a negative output gap of Y1 to Y.The spare capacity (unemployed workers and resources) will drive wages and other factor prices down. SRAS will shift from SRAS1 to SRAS2, resulting in the elimination of the output gap, as the economy moves back to long run equilibrium at B.
Measuring the Output Gap
Measuring the output gap is difficult, because we do not have completely accurate data for both of the following:
- Current level of GDP
- Potential (full capacity) GDP
GDP statistics can never be completely accurate; they are based on estimates from surveys of businesses. Furthermore, the statistics take time to compile and are out of date by the time they are published. GDP statistics are published quarterly in the UK (every three months) so they cannot tell us exactly what is happening to output at the moment. GDP statistics are also subject to frequent revision as more information about the past output becomes available.
The potential output of the economy is not much more than a ‘guesstimate’. The figure is produced by adding the trend rate of growth (calculated from past GDP data) to the latest GDP figure. For instance if GDP in 2016 was £100bn, and the trend rate of growth is 2%, the potential output of the economy in 2017 would be estimated at £102bn. But this takes no account of changes to potential output that might come about as a result of a big increase in investment or inward migration in 2017.
Changes to the Trend Rate of Growth
The trend rate of growth may rise or fall over time. Technological change may push the long term growth rate up. There is much discussion at present about ‘artificial intelligence’ (AI) and how robots may dramatically increase productivity, for instance. On the other hand demographic change such as an ageing population could shrink the size of the labour force.

There is also the possibility of the long term growth rate falling due to hysterisis. This can happen after a very long and deep recession in which output falls substantially below capacity for an extended period of time. Most recessions only last for a few months, but a severe recession, such as the one following the financial crash of 2007/8 can last for 2 years or more.
When this happens there is an increase in long term unemployment and business failures. Workers who fail to find a new job for such a long period of time may become ‘discouraged workers’ and give up looking for work. The productive capacity of the economy therefore falls, and growth in a recovery may be weaker than before. Businesses may also lay off workers in a deep recession, whose skills may then be out of date by the time the economy recovers. This leaves the economy with a smaller pool of skilled labour.