Inflation
Definitions
Inflation is the ongoing increase in the average level of prices across the economy over a period of time (usually expressed as an annual rate). It is a process rather than a one of event. It therefore means that the exchange (real) value of money is falling. An inflation rate of 4% would mean that £104 at the end of the year would be needed to purchase the same quantity of goods that could be bought for £100 at the beginning of the year.We could also say that the _cost of living _has increased by 4%.
__Deflation __is the opposite of inflation; it means the average price level across the economy is falling over time.
Disinflation means a fall in the rate of inflation, say from 4% to 3%. Do not confuse it with deflation; prices are still rising, but at a slower rate.
How Inflation is Measured
Inflation is measured using index numbers. A base year (starting point) is selected. In the base year the prices of a wide range of goods and services are recorded. In the base year all prices have an index of 100. This ‘basket’ of items is representative of the spending of the ‘average’ UK household. It is based on data collected by the Office of National Statistics (ONS) from a survey of several thousand households. The prices of the items are updated each month.

A system of weighting is used to take account of the % of income spent on each good. Changes in the prices of goods we spend a lot on will have a much bigger impact on the spending power of money than items we spend little on. For instance, if we spend £40 a week on petrol and it goes up in price by 10%, we will need to spend £4 more each week for the same amount of petrol. If we spend only £10 a week on electricity, a 10% price rise would only require an increase in weekly spending of £1. The ONS uses a system of weights that totals to 1000, so if food accounts for 20% of average household spending it would have a weight of 200 (20% of 1000).
Example
Suppose there are just 3 items of household spending; bread, milk and rent. The percentages of spending on each item (expressed as a weight out of 1000) and their prices in Years 1 & 2 are as follows:
| Item | Weight | Y1 Price | Y2 Price | Y2 Price Index | Weighted Price for Each Item Index |
| Bread | 200 | £1.00 per loaf | £1.10 per loaf | 110 | 22000 |
| Milk | 300 | £0.50 per pint | £0.60 per pint | 120 | 36000 |
| Rent | 500 | £50 per week | £53 per week | 106 | 53000 |
The Price Index in Year 2 measures the % change from Year 1; respectively 10%, 20% and 6% (remember that in Year 1 the index of all prices is 100).
The weighted index for each item is simply the price index multiplied by the weight.
To calculate the rate of inflation in Year 2 (compared to Year 1), we need to complete 3 further steps:
Firstly, calculate the total weighted index for all three items (=110000)
Secondly, divide the total weighted index by the total weights to get the price index for Year 2:
(110000 / 1000 = 110)
Finally, measure the percentage change in the price index for Year 2, compared to Year 1:
(Y2 Price Index – Y1 Price Index) / Year 1 Price Index X 100
(110 -100) / 100 X 100 = 10%
__NB: __If we simply use the average price for the three goods, (10%+20%+6%) / 3, we would get an answer of 12%, not 10%, because we haven’t taken account of how much is spent on each good. Rent swallows half of all spending, but has only gone up by 6%.
Over a number of years, spending patterns change, so the system of weights has to change. Some goods may disappear completely, and new ones appear (mobile phones were hardly known 30 years ago). This makes it had to compare inflation rates over a very long period of time, as the goods we buy can change a great deal. It should also be remembered that the _quality _of goods changes over time, generally getting better. For instance, the latest ‘smart’ phones have many more functions than their predecessors. They may cost more, but they do a lot more too. The price index does not capture this change in quality.
Deflation
This is when prices are falling. It sounds desirable, but it isn’t. It increases the real value of debt and the level of real interest rates, both of which are harmful to growth. It usually results in a prolonged recession as governments can’t easily stimulate demand by lowering interest rates. Even at 0%, real interest rates are positive if inflation is negative.
Deflation can lead to the so called ‘death spiral’,when falling prices encourage households to postpone spending in anticipation of further price falls. This causes output to fall, job losses and a further fall in prices as demand is weak. A downward spiral is set in motion. This happened in Japan after 1995, following the collapse of a property boom, resulting in nearly 20 years of recession or low growth.
Causes of Inflation
Inflation is caused either by excess demand or by increasing costs. These are called respectively demand pull inflation __and __cost push inflation.
Demand pull inflation occurs when the total level of spending in the economy, called aggregate demand cannot be met by an increase in aggregate supply. This is shown in Fig 1 below:
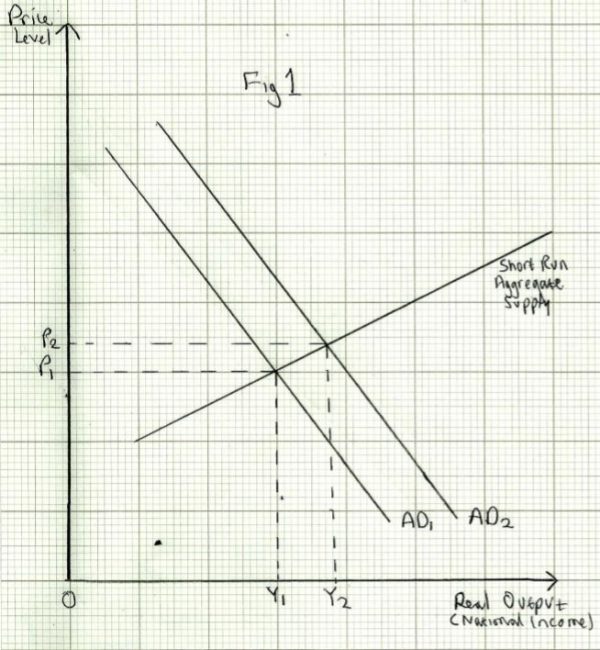
An increase in aggregate demand is shown by the shift from AD1 to AD2. There is some increase in real output (from Y1 to Y2), but it is not sufficient to absorb all the extra spending, so there is an increase in the price level from P1 to P2.
Excess demand can result from increases in any of the components of aggregate demand:
- Consumer Spending – This could be rising due to tax cuts, lower interest rates or increased consumer confidence
- Investment – Businesses may be confident and anticipating increased sales and profits so spend more on machines and buildings to increase capacity
- Government spending – An increase in government spending that is financed by borrowing, rather than raising taxes will increase aggregate demand
- Exports – If the economies of our trading partners are expanding, it will result in increased demand for British exports.
Note that demand pull inflation is most likely to occur when the economy is close to full employment. It is then difficult to meet rising demand by increasing output. This is why demand pull inflation is generally associated with an economy that is growing quite rapidly, possibly in a ‘boom’ phase.
Some economists argue that demand pull inflation is largely caused by governments and central banks like the Bank of England. If the __money supply __(especially the amount of borrowing in the economy) is allowed to expand faster than the real output of the economy, it will create excess demand and therefore inflation. Governments may also be tempted to pay for public expenditure by printing more money, rather than raising taxes. This is a kind of confidence trick; the public still has to pay for it, but through rising prices in the shops rather than bigger tax bills.
_Cost push inflation __results from rising cost of production. This is shown in Fig 2_ below:
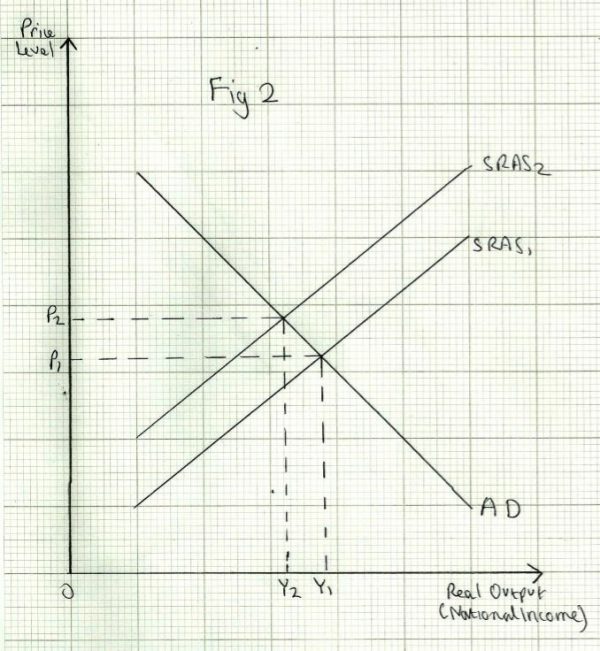
Rising costs result in an upward shift of the short run aggregate supply curve, from SRAS1 to SRAS2. The outcome is an increase in the price level from P1 to P2 and a fall in real output, from Y1 to Y2.
Rising costs could be caused by any of the following:
- Higher commodities prices – For instance an increase in world oil prices. This will raise costs for almost every business.
- Wages and salary increases – If they rise faster than productivity, costs of production will rise.
- Indirect tax increases – An increase in VAT or excise duty will increase businesses costs, which they will try to pass on to customers in higher prices.
- Fall in the exchange rate_ – _This will cause a rise in import prices and therefore inflation.

Effects of Inflation
In recent years inflation has not generally been regarded as a serious problem, as it has been low and stable. It should be remembered that most central banks set an inflation target of around 2%, rather than zero. This is because a mild level of inflation produces an optimistic climate, as businesses see rising sales and profits, and households usually see their incomes rising. Mild inflation is therefore seen as good for growth.
When inflation is significantly higher (towards 10% or more) it is seen as a problem for the following reasons:
- Competitiveness – If inflation is higher in the U.K. Compared to other countries it may make British goods less competitive, causing a worsening balance of payments. The problem may be offset by a all in the exchange rate, but this will create further inflationary pressure in the long run
- Growth and employment – If competitiveness is worsened, this will lead to a fall in output and a loss of jobs in the firms affected. Also, policies to bring inflation down (mainly by raising interest rates) will reduce the level of investment and consumer spending. High inflation can also cause a loss of business and consumer confidence, resulting in less investment and more saving (as households try to maintain the future value of their ‘nest eggs’), which damages growth and jobs
- ‘Shoe leather costs’ – When prices are changing frequently it is more difficult for consumers and businesses to find the best prices when making purchases, so more time and effort is spent lookin for the best price
- __Menu costs __– Businesses may need to adjust their prices more frequently when inflation is high; this can add to costs as changes will need to be made to published prices, packaging and other printed material
- Redistribution of income and wealth – Inflation reduces the real value of people’s savings, but at the same time it reduces the real value of debts, so borrowers tend to benefit at the expense of savers. Also, if inflation is higher than interest rates, real interest rates will be negative, again benefiting borrowers but penalising savers.
Extreme rates of inflation called hyper-inflation can result in social and political unrest. The rise of Hitler was partly the result of the fact that millions of people saw their savings become worthless, provoking conflict and the scape-goating of minorities.
Households who cannot increase their incomes as much as inflation will experience a fall in real incomes. This may include low skilled workers with little bargaining power and older people living off fixed private pensions.
The government is the biggest borrower of all, so inflation can have a positive effect on public finances as the real value of the national debt is reduced. The government may also benefit from higher tax revenues if it does not increase income tax personal allowances in line with inflation. On the other hand, if it does not raise excise duties (eg on petrol, tobacco and alcohol) the real value of tax revenues will fall.

NB: __It is when the rate of inflation is __unanticipated that the most harmful consequences happen. If inflation is anticipated accurately, it is possible to take it into account. For instance, businesses can plan to increase wages to their workers, and prices to their customers by the expected rate of inflation. The best guide is probably what has been happening to inflation recently, and whether it is stable, rising or falling.
Different Measures of Inflation
There is no ‘perfect’ measure of inflation. We all spend our money in different ways. Poorer households, for instance spend a greater % of income on keeping warm and food and a smaller % on entertainment and holidays compared to richer households.
The __Consumer Price Index (CPI) __is the most widely used measure. It is based on internationally agreed methods by European countries, so can be used when making comparisons between them.
But, it does not include certain housing costs, such as mortgage interest rates, which can change very significantly in the short term. It is the measure used for index linking state pensions and for setting the inflation target (currently 2%) by the Bank of England.
The__ Retail Price Index (RPI) does include mortgage interest rates. At the moment (2017), the two measures of inflation move fairly closely together, as interest rates have been low and stable for some time. But if mortgage rates rose significantly (as they have in the past), the RPI would show a higher rate of inflation than the CPI, and vice versa if interest rates fell. There have been periods of great volatility in interest rates, so the CPI is generally regarded as a more reliable measure of underlying, or __core inflation. The CPI is therefore used when measuring inflation against the Bank of England inflation target of 2%.