Demand
Definition of Demand
In economics, ‘demand’ means the quantity of a good that consumers will actually buy at any given price, in a given period of time.
Note also that we are only interested in effective demand, which refers to how much we actually buy, rather than the amount we would ideally like to buy if we had more resources.
For the vast majority of goods, there is an inverse relationship between quantity demanded and price; we buy more at a lower price and vice versa, ceterusparibus _(provided that nothing other than price changes)._
Consider_ Table 1_ below, called a ‘demand schedule’ for milk:
| Price (£ per litre) | Quantity Demanded (millions of litres per day) |
| 2 | 1 |
| 1.8 | 2 |
| 1.6 | 3 |
| 1.4 | 4 |
| 1.2 | 5 |
| 1 | 6 |
We can plot this data on a two dimensional graph, in Fig 1 below:
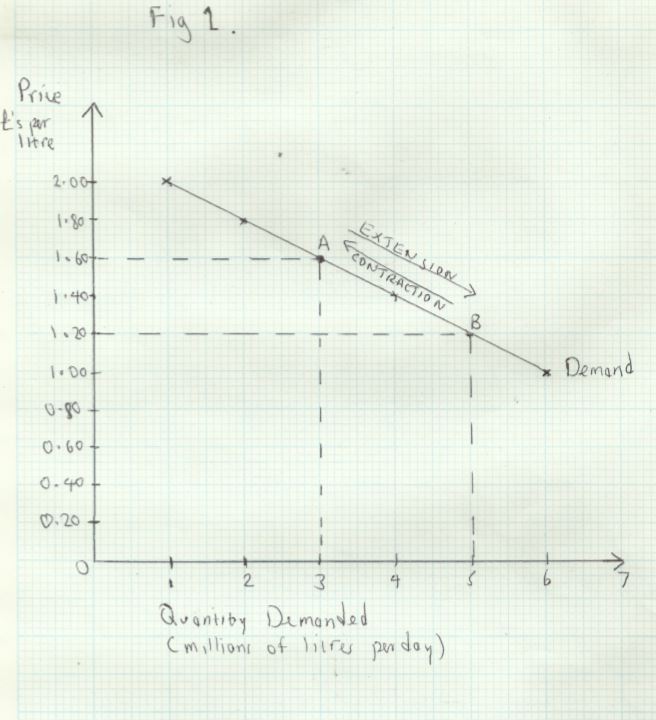
The line plotting the quantity demanded against price is called the ‘demand curve’. It shows the quantity demanded at each price. For instance, at point __A __price and quantity are respectively £1.60 and 3 million.
If price falls to £1.20, demand goes up to 5 million. This is shown at point B. This movement along the demand curve from A __to __B __is called an extension of demand__. Correspondingly, a rise in price, such as the movement from B __to A is called a __contraction of demand.
Changes in the Conditions of Demand
The demand schedule and demand curve reflect the _ceterus paribus _assumption, that quantity demanded is changing only in response to a change in price. In the real world there are many other influences on demand, and these may cause the demand curve to shift outwards to the right, or inwards, to the left. These changes are called respectively increases/decreases in demand.
Look again at _Table 1. _Suppose there have been news reports that milk has proven health benefits. This would result in more milk being demanded at each price. Let’s suppose that demand increases by 1 million litres at each price. The effect of this increase in demand is shown in _Fig 2 _below:
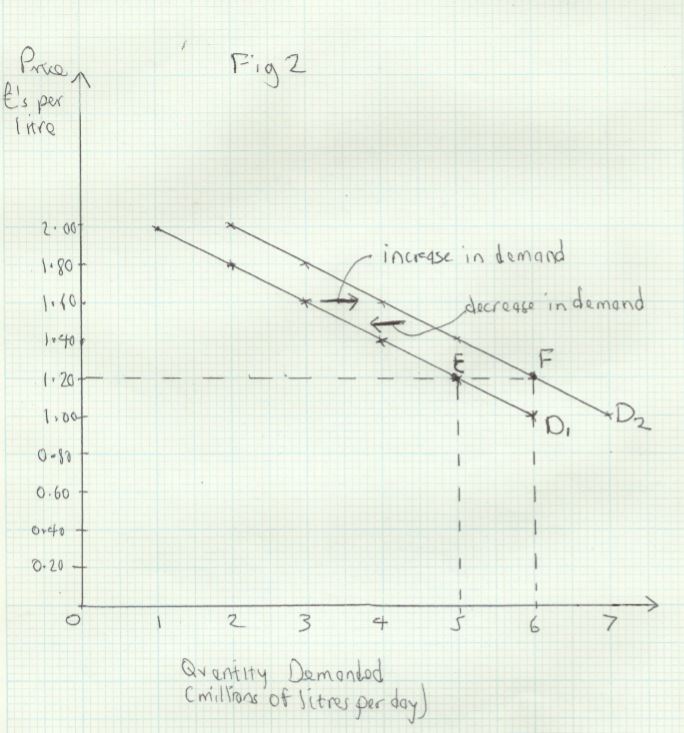
We can see that the increase in demand shifts the demand curve from D1 __to __D2. Before the health benefits news story, the quantity demanded at a price of £1.20 was 5 million. Now it is 6 million. This is shown by the movement from point E to point F. Similarly, at all other prices demand has increased by 1 million litres. Conversely, a shift from point__ F to __E would represent a decrease in demand.
All the factors that influence demand apart from price are called the conditions of demand. A change in any of these conditions results in an increase/decrease in demand. The main conditions of demand are:
- __Income __- for most goods, called normal goods, an increase in income will result in an increase in demand, and vice versa if income falls. For inferior goods, the opposite is true
- __Changes in the price of other related goods __-a rise in the price of butter could result in an increase in the demand for margarine, because they are substitute goods. A rise in the price of a complement or jointly demanded good would cause the demand for the related good to decrease. For example, an increase in air fares could cause a decrease in demand for holidays abroad
- __Changes in tastes or fashion __- this could result from advertising campaigns, trends on social media or news stories
- __Government policy __- regulation, such as restricting sale of alcohol to over 18s (decrease in demand), or giving parents of young children vouchers for nursery education (increase in demand) are two examples
- __Demographic change __- a change in the total population, or its structure can affect the demand for many goods.
Why the Demand Curve Slopes Downwards
__Utility __refers to the satisfaction or value we derive from consuming a good. Marginal utility is the value we get from the last or marginal unit we consume (in a given time period). The law of diminishing marginal utility states that we derive less utility from each successive unit of a good that we consume, and consequently we are willing to pay a lower price, the more of a good we consume.
The demand curve shows the price a consumer is prepared to pay for each quantity. This is shown in _Fig 3 _below:
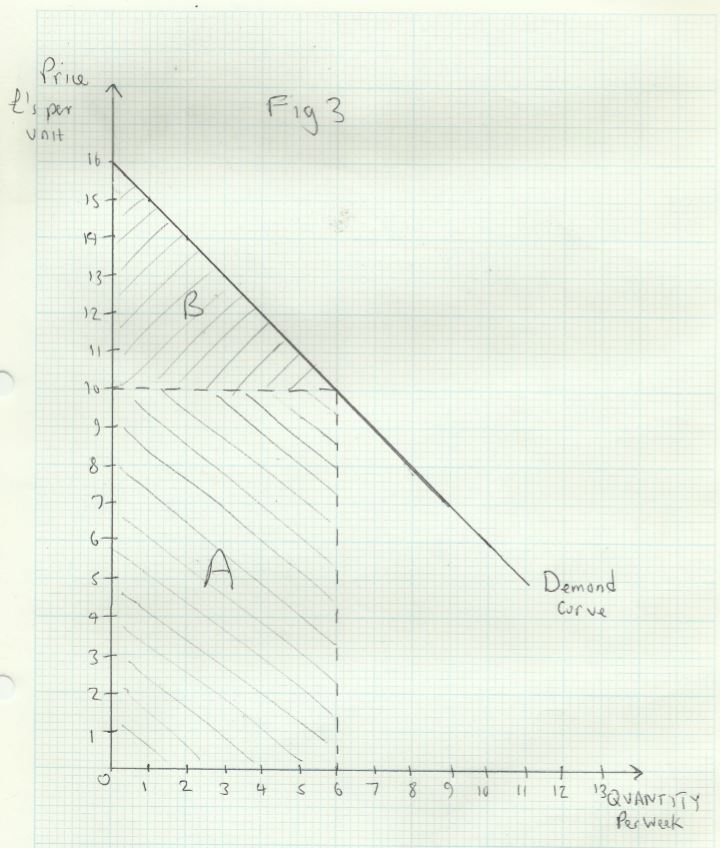
The consumer would only be willing to buy one unit at a price of £15, two units at a price of £14 and so on. Our willingness to pay a lower reflects the lower marginal utility of the second unit. In other words, the consumer enjoys £15 worth of utility for the first unit, £14 for the second and so on.
Consumer Surplus
Suppose the market price is £10, so the actual quantity consumed is 6 units. The consumer’s total expenditure would be £60, shown by area __A __in _Fig 3. _But the the value of the consumer’s total utility is actually £75. This is equal to the sum of the marginal utilities of each successive unit (£15+£14+£13+£12+£11+£10).
The consumer’s total utility is equal to what she would have been prepared to pay (£75) if she had to negotiate the purchase of each unit separately. This is shown by area A+B. In fact she can buy them all at the same price (£10).

The difference between what the consumer actually spends, and what they would have been prepared to spend is called consumer surplus. This is shown by area B.