Indirect Taxes and Subsidies
Definitions
There are two broad ways in which governments can levy taxes. Direct taxes are collected directly from the individuals and businesses who ultimately bear the burden of paying them. Income tax (paid by individuals) and corporation tax (paid by companies on their profits) are the main direct taxes.
Indirect taxes are taxes on spending. VAT and Excise Duties (on things like alcohol, tobacco and petrol) are the most important ones. These taxes are collected from businesses when they sell goods and services, but may be passed on to consumers, in part or completely, by raising price. The incidence (or burden) of indirect taxes is therefore shared between consumer and producer.
Some indirect taxes are a percentage of the value of the goods. These are called ad valorem taxes. For instance VAT is currently 20% of the price of most goods and services. Excise duties are based on the physical quantity of the good sold and are called specific taxes. For instance the excise duty on spirits such as whisky is currently £11.50 per litre. Goods subject to excise duties are also subject to VAT, so that the prices of petrol, tobacco products and spirits are very heavily taxed.
A __subsidy __is a payment by the government, either to the producer or consumer, but we are mainly concerned here with producer subsidies, particularly those which are paid at a given rate per unit of output. For instance, a government may subsidise the steel industry by giving producers £100 for every ton of steel produced. As with indirect taxes, the impact of a subsidy may be shared between producers and consumers, as producers may lower prices, but not by the full amount of the subsidy.

Objectives of Taxes and Subsidies
The primary objective of indirect taxes is to raise revenue for the government to pay for public expenditure. But there are other important objectives too.
Because taxes (and subsidies) affect the market prices of goods and services, they can be used to influence the quantities that are produced and consumed. If the government wishes to reduce output and consumption of a good it will levy a tax on it, whereas a subsidy can be used to increase it.
Price Elasticity and the Incidence of the Tax
Note that in _Fig 1 _the tax burden is not equally shared between producers and consumers. In this case the incidence of the tax falls mainly on the producers. This is because demand is relatively elastic compared to supply. This means that producers can only raise the price by a small amount. An attempt to pass more of the tax on to consumers would cause a large fall in demand.
By contrast, a situation where demand is relatively inelastic compared to supply would result in consumers bearing the greater share of the tax.
When do consumers pay all the tax?
Producers can pass the whole of the tax onto consumers in two special circumstances, shown in _Fig 2 _below:
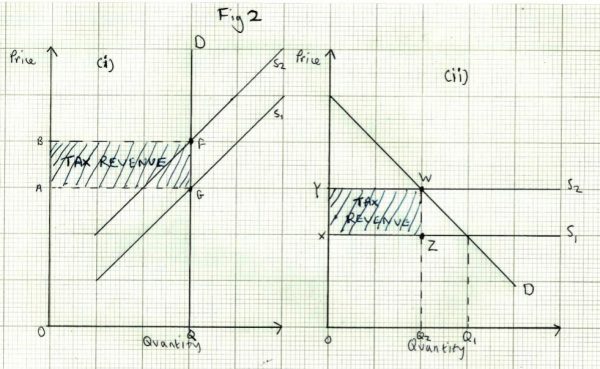
In diagram (i) _demand is perfectly inelastic, and in diagram _(ii) _supply is perfectly elastic. In both cases, market price increases by the full amount of the tax per unit (FG and WZ respectively). So consumers pay all the tax (BFGA __and YWZX __respectively) The difference between the two situations is that the market quantity does not change at all when demand is perfectly inelastic, but it falls when the demand curve is ‘normal’, as in diagram _(ii).
When do Producers Pay All the Tax?
Producers bear the entire burden of the tax when they can’t raise the price at all. This arises in two special circumstances, shown in _Fig 3 _below:
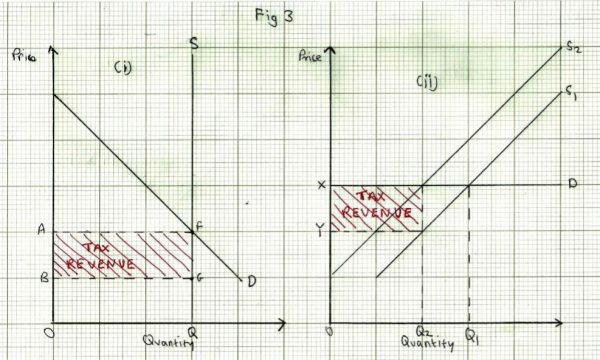
In diagram (i) _supply is perfectly inelastic, and in diagram _(ii) _demand is perfectly elastic. In both cases, market price does not change at all, so all of the tax per unit (FG and WZ respectively) is paid by producers. Producers therefore pay all the tax (AFGB __and __XWZY respectively). The difference between the two situations is that the market quantity does not change at all when supply is perfectly inelastic, but it falls when the supply curve is ‘normal’, as in diagram _(ii).
The Impact of a Specific Tax
Fig 1 (below) shows the market demand and supply for a good:
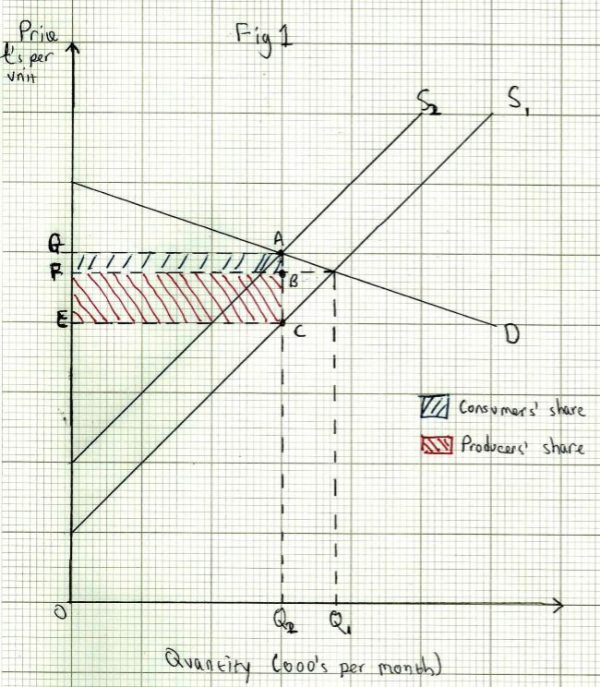
The imposition of a specific tax will shift the supply curve vertically upwards, from S1 to S2. The vertical distance between the two supply curves is the amount of tax per unit, shown by AC __on the diagram. Note that the supply curves are parallel, as the the tax per unit is constant at all prices. To be willing to supply any given quantity (eg __Q2), producers will want the price to be higher than before, by the amount of the tax per unit, to compensate for having to pay the tax.
We can see the following consequences, following the introduction of a specific tax of __AC __per unit:
- Market quantity falls from Q1 __to __Q2
- Market price rises from __OF __to __OG __per unit
- Total tax revenue is equal to area __GACE __(tax per unit X market quantity)
- The consumers’ share of the tax is area GABF (the rise in price X market quantity)
- The producers’ share of the tax is area FBCE.
This is because producers now receive the market price minus the tax, so they now only receive OE __per unit, whereas before the tax was introduced they received the whole market price __OF. The total cost of the tax to producers is therefore their share of the tax per unit, FE X market quantity.
The Impact of an Ad Valorem Tax
An ad valorem tax has the same economic consequences as a specific tax, (see _Fig 4 _below) but note that the supply curves S1 and __S2 __are not parallel. They diverge because the amount of tax per unit increases with price. For instance, a 20% tax would result in a tax per unit of £2.00 at a price of £10, but would be £4.00 per unit if the price was £20.
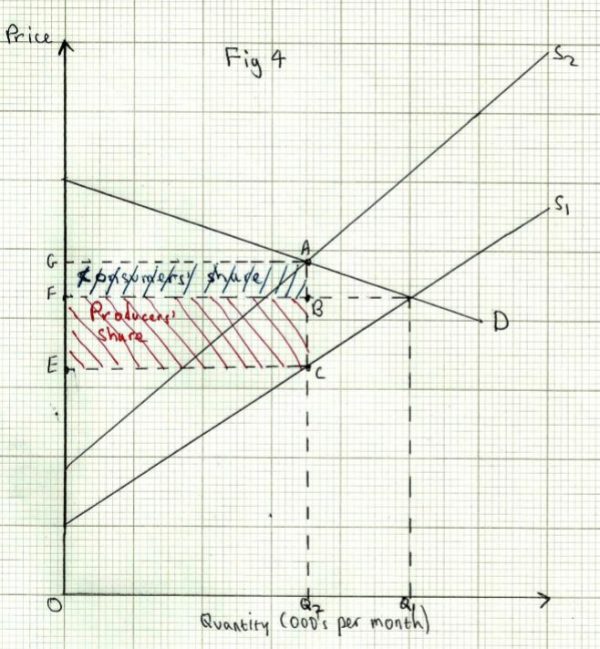
- Market quantity falls from Q1 __to __Q2
- Market price rises from __OF __to __OG __per unit
- Total tax revenue is equal to area __GACE __(tax per unit X market quantity)
- The consumers’ share of the tax is area GABF (the rise in price X market quantity)
- The producers’ share of the tax is area FBCE.
This is because producers now receive the market price minus the tax, so they now only receive OE __per unit, whereas before the tax was introduced they received the whole market price __OF. The total cost of the tax to producers is therefore their share of the tax per unit, FE X market quantity.
Price Elasticity of Demand and Government Policy
Where the main objective of the tax is simply to raise revenue, governments are likely to target goods and services in relatively inelastic demand, such as tobacco and petrol. But where the objective is to reduce demand (so called ‘sin taxes’) it is most likely to be effective if demand is elastic. Unfortunately these objectives often conflict, as in the cases of alcohol, tobacco and petrol, which are reliable sources of tax revenue, but where it is difficult to reduce demand without imposing tax rates that the public would oppose.
Subsidies
The effect of a subsidy is shown in Fig 5 below:
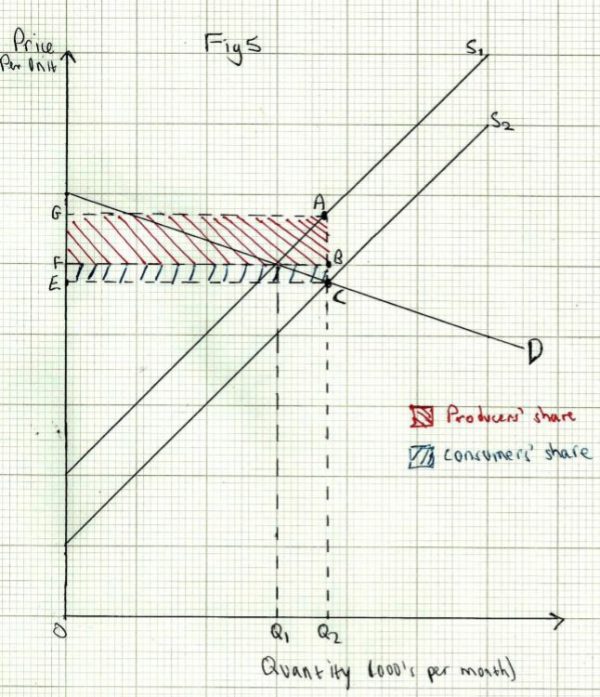
The imposition of a subsidy will shift the supply curve vertically downwards, from S1 to S2. The vertical distance between the two supply curves is the amount of subsidy per unit, shown by AC __on the diagram. Note that the supply curves are parallel, as the the subsidy per unit is constant at all prices. To be willing to supply any given quantity (eg __Q2), producers will accept a lower price than before, by the amount of the subsidy per unit, since they will receive the market price plus the subsidy.
- Market quantity increases from Q1 __to __Q2
- Market price falls from __OF __to __OE __per unit
- Total cost to the government of the subsidy is equal to area __GACE __(subsidy per unit X market quantity)
- The consumers’ share of the subsidy is area FBCE (the fall in price X market quantity)
- The producers’ share of the subsidy is area GABF. (Producers receive the market price, __OE __plus the subsidy, __AC __per unit, so they gain __GF __on each unit. The total gain to producers is therefore __GF __X market quantity)
As with taxes, the subsidy may not be shared equally between producers and consumers, as is the case in _Fig 5, _where producers are getting the larger share of the subsidy. This is because demand in this case is relatively elastic compared to supply. Price does not fall very much, so consumers only capture a small part of the subsidy. Where demand is relatively inelastic compared to supply, consumers will gain most of the subsidy, as price will fall steeply.