Production Possibility Frontiers
Production Possibility Frontiers
We can represent the concepts of scarcity, choice and opportunity cost in a simple two dimensional diagram called a production possibility frontier (PPF) diagram.
We make the following assumptions:
The economy of country X can produce two goods only (let’s call them wheat and tractors).
The country has a given quantity of factors of production which it can allocate to the production of either good.
In the diagram (Fig 1) below, if country x devoted all its resources to tractor production it could produce OA tractors in a year, and zero tons of wheat.
If all resources were devoted to wheat production, it could produce OB tons, and zero tractors.
The curved line AB shows all the possible combinations of output of wheat and tractors that could be produced, provided that all resources are employed.
For instance, at point C it could produce OW tractors and OR tons of wheat:
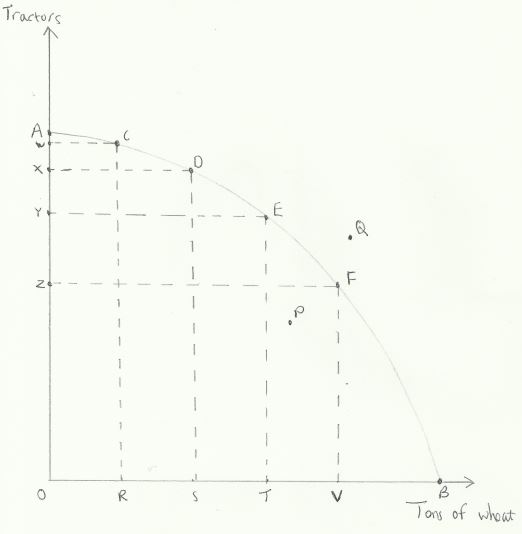
The PPF illustrates how resources are scarce. Consider point Q. At this point the economy would be producing more of both wheat and tractors, compared to point F. But this point lies outside of the PPF, indicating that more resources (factors of production) are required.
It therefore follows that, given our current limited stock of resources, to increase the production of one good means sacrificing some production of the other good. There are competing uses of resources, so they are scarce.
Note also that the PPF is a curved line, bending out (concave) from the origin. This is because factors of production are not equally productive in all uses. To explain this, suppose the economy is initially at point A, so that only tractors are being produced. If we move to point C, we would sacrifice AW tractors in order to gain OR tons of wheat. So we can say that AW tractors is the opportunity cost of producing OR tons of wheat. We make only a small sacrifice in tractor production because we can move resources such as workers with little manufacturing skills into agriculture, where they may have more suitable skills.
Now suppose that we decide to increase wheat production again, moving to point D on the PPF. We can see from Fig 1 that w have gained the same additional amount of wheat as before (RS = OR), but it has come at an increased opportunity cost, as this time we have had to sacrifice XY tractors. The increased opportunity cost arises because we have to start transferring resources that are more productive in manufacturing, and less productive in agriculture.
Fig1 shows that as we continue to produce more wheat, the opportunity cost gets bigger still. Thus as we move from point E to F we have to sacrifice YZ tractors to gain TV tons of wheat. Equally, if we choose to produce more tractors, the opportunity cost in terms of wheat will increase.
In other words, given our current stock of resources, the marginal cost of producing additional quantities of either good will increase.
Allocative and Productive Efficiency
Much of economics is concerned with using resources as efficiently as possible.
Productive efficiency is defined as producing goods and services at the lowest cost. This occurs anywhere along the PPF. On the PPF curve, all our resources are being used, so it is impossible to produce more of one good without producing less of another. If, for instance, we found a way of producing the combination of wheat and tractors shown at point D on Fig 1 which left us with some unused resources, then the PPF would have shifted outwards.

Look at Fig 1 again and consider point P. We can see that it lies inside the PPF, which means that not all resources are being employed. It is therefore not a productively efficient outcome. Resources are being wasted. We could produce more of both wheat and tractors if the economy moved to point F.
Allocative efficiency is about producing the right combination of goods to maximise the satisfaction of our wants and needs. This could be anywhere along the PPF, but is unlikely to be close to either end of it. For instance, at OA we would be producing only tractors and so have no food to eat.
Economic Growth and the PPF
An economy grows if it produces more goods and services in a given time period. This is usually measured by GDP. We can distinguish between short and long term growth.
Short term growth means producing more goods and services from the resources that are available. This is possible if the economy is currently operating inside its PPF. This is shown by a move from P to F in Fig 1. This may occur when an economy emerges from a recession, as unemployed resources are put back into production.
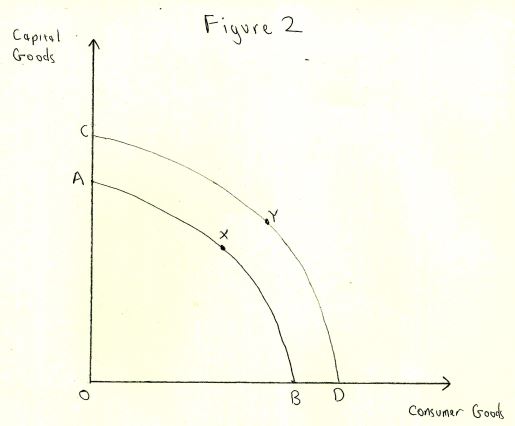
Long term growth occurs as a result of an increase in the productive capacity of an economy. This is shown in Fig 2 below. The whole PPF has shifted out to the right, from AB to CD. So at point Y, the economy is producing more of both capital goods and consumer goods, compared to point X.
Long term growth comes about over time as a result of acquiring more, or better resources, for example:
- An increase in the supply of workers
- Improved education and training
- Technological change
- Discovery of new mineral deposits
Note that economic growth can be negative too. In the short term an economy can go into recession. Long term negative growth could result from warfare or natural disasters, for instance.
Growth Path A shows the long term trend of an economy’s productive capacity. It also demonstrates that choices we make in the present have an opportunity cost in the future. Consider Fig 3 below:
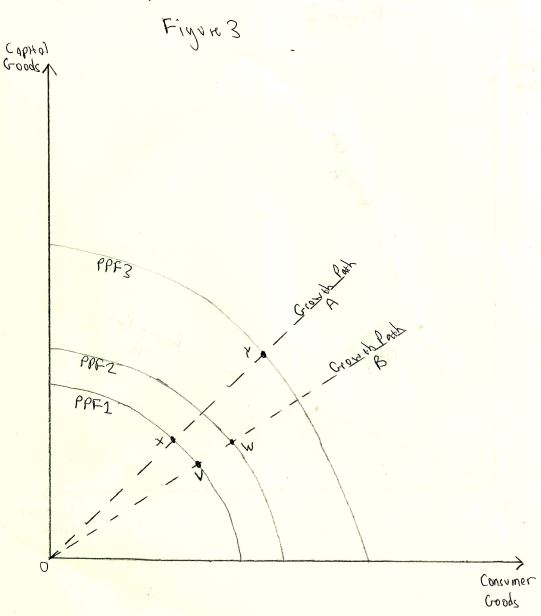
Suppose there are two countries, A and B. Initially they have the same stock of resources, as shown by PPF1. Country A is at point X, choosing to devote more of its resources to producing capital goods than country B, which is at point V. So country B is enjoying higher living standards in the short term as it is producing more consumer goods.
But in the long term, country A will grow at a faster rate, as it is building up a greater stock of capital goods. This is shown by country A moving on to PPF3, whereas country B only moves to PPF2. Country A is now at point Y, producing more consumer goods as well as capital goods, than country B which is at point W.
By choosing growth path A, a country is making short term sacrifices of current living standards for long term gain, compared to growth path B.