The Characteristics of Aggregate Demand
The Characteristics of Aggregate Demand
__Aggregate demand __(AD) is the sum total of all expenditure on domestically produced goods and services in a given time period, at any given price level. It is defined by the following equation:
AD = C + I + G + (X - M)
Where: C = Consumption, I = Investment, G = Government Spending, X = Exports, M = Imports
Note the emphasis on domestically produced goods and services. Imports represents the spending on goods made abroad, and so is part of the AD of other countries. It therefore has to be deducted from the total spending.
__Consumption __is spending by consumers on goods and services that satisfies wants, such as food, clothing, entertainment, electrical goods and so on. It is the largest component of AD. In the U.K. it accounts for 65% of AD. This is one reason why there is so much attention paid to it, as growth and employment are heavily dependent on it. By contrast, in China, consumption is only about 40% of GDP.

Investment __is spending on capital goods, such as machines and buildings, but also includes spending on __working capital which is made up of stocks of semi-finished and finished goods that will eventually be sold. About 75% of investment is undertaken by private businesses. The rest is spent by government and local authorities on things like roads, hospitals, schools and social house building. In the U.K. investment spending varies between about 15% and 20%. It is the most unstable of all the components of AD, as it is heavily affected by the level of business confidence in the future. Britain has a lower level of investment spending than some of our competitors, especially China, where it is closer to 40% of GDP. This partly explains why China has such a high rate of growth.
__Government spending __This is government and local authority __current __spending, which means providing goods and services, but not capital spending. It includes things like the wages and salaries of doctors, nurses and teachers, the cost of supplying medicines and textbooks. But it doesn’t include spending on building schools or hospitals.
Note also that it does not include spending on transfer payments (state benefits and pensions), which actually account for a large slice of public expenditure. They are not included because they are not part of GDP. A benefit payment simply redistributes income from taxpayers to recipients; there is no output (and therefore no contribution to national income) resulting from this spending.
In the U.K. government current spending is about 20% of GDP, but if you add in transfer payments and public investment spending it is more like 40%.
__Exports __is spending by foreigners on goods and services made in the U.K., in other words it includes both visible and invisible items.
Imports is spending by consumers, firms and government on goods and services made abroad.
Net exports (X-M) As explained above, imports have to be deducted from total spending. The value of net exports is positive if X > M and negative if M > X. In the former case this means the country is running a current account surplus on the balance of payments and vice versa. In recent years the U.K. has run a deficit of about 4% of GDP, so the effect on AD has been negative.
The AD Curve
Aggregate demand can be shown on a two dimensional graph. The horizontal axis measures the level of real national income, or output, adjusted for inflation. The vertical axis measures the average price level of goods and services. (technically this is the money value of all spending divided by the number of transactions).
Fig 1 below shows aggregate demand. Let us suppose that initially aggregate demand is represented by AD1.
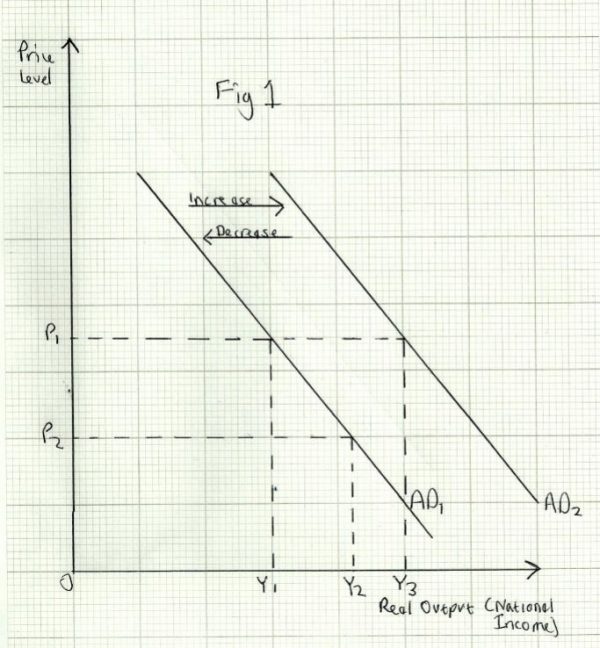
You can see that the AD curve slopes downwards from left to right, showing that AD, as measured by the real level of output is higher when prices fall and vice versa. For instance, at price level P1, real output is at Y1. __If the price level falls to __P2, real output goes up to Y2.
There is a number of reasons for this inverse relationship between the price level and real output:
- If prices fall, households and businesses can buy more goods and services with the same money income. In other words the level of real income has risen
- Falling prices of goods and services also causes an increase in real If I have £50,000 in savings it is worth more in terms of goods and services. This may encourage households to spend more and save less. This is known as a wealth effect. We generally spend more when we are wealthier
- Falling prices will make the country’s exports more competitive, provided the exchange rate does not change. This will lead to increased exports and lower imports.
If the price level rises the opposite applies in each of the above cases, so the level of real output will be lower.
Note that a change in the price level results in a movement along the AD curve, ceterus paribus (provided that all the other factors affecting AD do not change). We now need to consider why the AD curve may shift outwards or inwards.
Consider the shift in AD from AD1 to AD2 in Fig 1. This is an increase in AD and means that at any given price level, the level of real output is higher. For instance, at price level P1, real output increases from Y1 __to __Y3. This is an increase in AD. Equally, a decrease in AD means that real output is lower at any given price level.
The level of AD will change if there are changes in any of the components of AD (C,I,G,X or M).