Development Gap
Indicators
It can be difficult to measure a country’s development.
- Data can also be misleading.
- For example, China’s growth data since 1980:
- are based on various different data collection methods
- Some data such as GDP show China as one of the leading superpowers at 2nd spot GDP around $11 trillion.
- Whereas per capita is 84th at around £14,000.
Other indicators exist in composite form (several set of data).
The most common is __economic sector balance __(the % contribution of primary, secondary & tertiary sectors to GNI).
A composite indicator measures multi-dimensional concepts
A __single __indicator usually measures economic value
Some other examples:
__Gross National Product - __The value of all the goods and services earned by a country including companies working abroad.
__Gross Domestic Product - __The value of all the goods and services earned by a country excluding foreign earnings.
__Per capita - __Statistics providing an average per person
__Human development Index - __Made up of life expectancy, literacy rates and infant
Physical quality of life index Made up of basic literacy rate, infant mortality, and life expectancy
Human suffering index - Made up of daily calorie intake, access to clean water, inflation rate, and access to communications, political freedom and civil rights
Gender Inequality Index - A composite measure reflecting inequality in achievements between women and men in three dimensions: reproductive health, empowerment and the labour mark
__Purchasing Power Parity (PPP) __- The average earnings related to local prices and what spending power they will buy. Reflects the local cost of living
<a href="/assets/img/assumeJPG/gMcPvfSp2HFxWMr7vowoNyGtgAcl56UK6R06V6ZR7PJK21VkeV-v9obCit8YtVqB-Fk8wnYYLmhHPQS7qbC96dDojn2xeODTQpohiFR-pCKyrQcukAifzVIQ5ExgcScTOjqTCi_5.jpg" target="_blank">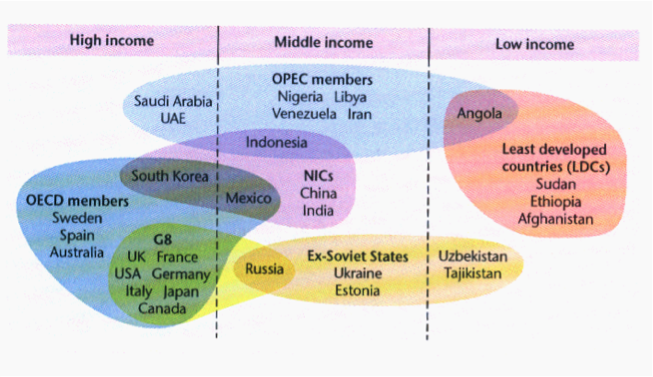</a>
Measuring Inequality
•The Lorenz curve is a graph that shows the distribution of income within a country
•It compares the cumulative % of population against the cumulative % of income
__But __it is hard to use the Lorenz curve to compare nations and inequality over time (as you’d have to draw loads of overlapping lines on a graph) 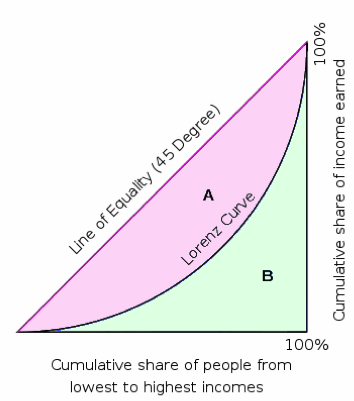
•The Gini coefficient is a measure of the degree of inequality in a society.
It gives you a nice neat number to measure income inequality within a country.
•This can then be used to compare between countries and over time.
•It is based on a ratio of areas from the Lorenz curve (the inequality area: the area it should be)
•This is given as a percentage (e.g. 41.1%) – Gini Index
•The Gini coefficient is just the Gini index divided by 100 (so between 0 and 1).
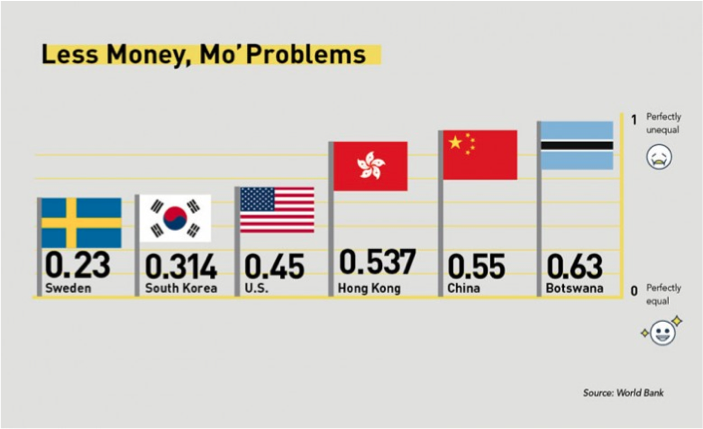
1 = very unequal
The poorer countries - such as Botswana, have a higher Gini Coefficient meaning they have a more unequal society.
Notice that China has a score of 0.55, making it a very unequal country within its borders.
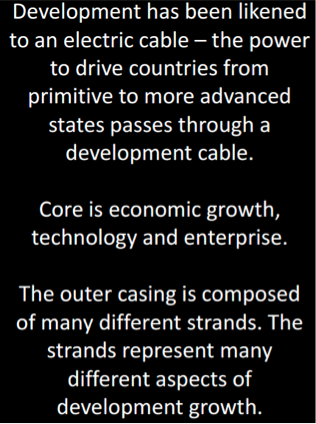
Models of Development
Trends
This video shows the trends in development over the past 200 years, for 200 countries.
•Globalisation is a positive sum game__ __however some are gaining more than others
•The overall size of the global economy (the pie) has increased but the shares of growth (slices) are not equal.
Some nations benefits more than others – why? And some regions within a nation benefit more than others – why?
Are LDCs catching up with MDCs?
•Rapid development __of many LDCs through trade and __specialisation – e.g. China and India
•FDI from TNCs is helping to kick start economies of__ FDI__ – especially alongside infrastructure and technology transfer – boosts AS (aggregate supply) and AD (aggregate demand) with a multiplier effect
__•Reduction in trade barriers __opens up richer MDC markets for trade – increases exports
•This has quickly boosted employment and incomes
BUT…
•__Economic leakage __as profits are ‘leaked’ back to MDC and top jobs go to labour in MDCs
•__Exploitation of LDCs __by TNCs including labour conditions, wages, environmental damage etc.
•__Monopsony power __of MDCs can still drive prices right down for many LDC nations keeping them poor and preventing a decent boost to AD or multiplier etc.
•__Many LDCs still left behind, __especially those dependent on primary products (Sub Saharan Africa very poor etc.)
Contrasting Management
The treatment of women is a good indicator of development.
- In many LICs fathers prevent their daughters from receiving education beyond puberty because school is expensive.
- Why support them financially when they will leave home on marrying and sons won’. This view is very hard to shift in many LICs/NEEs.
- Even in __HICs __women earn less than men and are less likely to be promoted.
UN has developed the __Gender Inequality Index __which uses composite data.
- Gender Inequality Index:
- Reproductive health
(As gender inequality declines, fertility rate (BR) & maternal mortality rates drop & the age of having your 1st child rises.
- Empowerment
Women enter politics and become more empowered
- Education/Employment
Staying in school/university opens up more opportunities for women
The link between __development and the environment __is well established.
- Air quality deteriorates as economic development increases.
- There are many causes
- e.g. energy productions, industry and increased car ownership.
- Most countries record air pollution and log air quality.
Questions:
- Explain how to measure development using different indicators. Why is this so difficult? HDI, GDP, economic indicators, social indicators, PPP, Human suffering index, indices.
- Discuss ‘the rich get richer while the poor get poorer’. Are LDCs going to stay poor? Development, economic, investment, FDI, financial leakage.
- Explain how we can measure inequality within a country? Why are there such disparities within countries? Gini Coefficient, development gap, rural and urban, poverty, Lorenz curve.