Classifications of Economy
Place
•Geographical spaces shaped by individuals and communities over time
- Place has an emotional connection to it with meaning
- Space is just an open broad location
Clarke Fisher

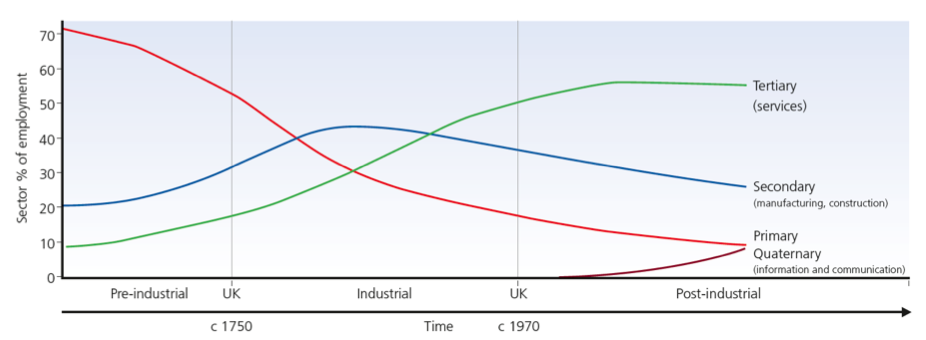
- Explain what the Clarke-Fisher model shows.
- Your answer should include: Employment / primary / quaternary / secondary / tertiary.
Changes in Employment
- __Reducing primary and secondary __sectors has consequences on low skilled workers
- meaning unemployment rises for low skilled workers
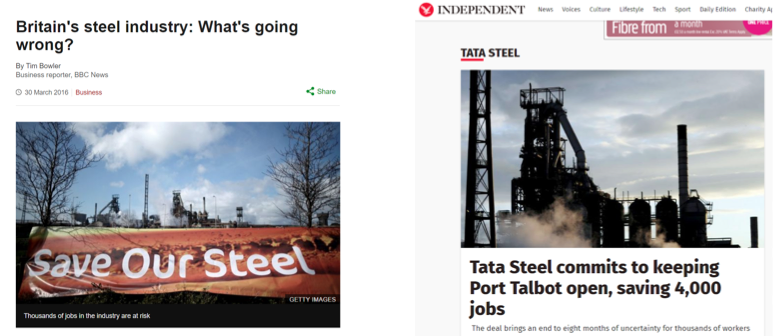
- Areas like Leicester (which has a stronghold over manufacturing jobs, like steel production) could make this area go into decline.
-
Fewer jobs mean less employment and a cycle of decline and depression could start in the area, affecting other jobs and education.
- Expanding tertiary and quaternary also has consequences
- Forcing more people to go to university
- Creating more of a knowledge economy
- As this happens, some people may be priced out of such an education.
- Investment in research may rise, as well as university places.
Different Areas
Shift to a post-industrial economy in the UK has been more successful in some areas than others.
- Growing up in poverty and the likelihood of dropping out of further education are linked to ill health later in life.
- Also works the other way around- ill health and disability can impact people’s__ ability to work.__
- Causes of deaths that are__ higher in deprived __areas include; cardiovascular conditions, lung cancer, cirrhosis of the liver, respiratory diseases and suicides.
CAMDEN:
- 34% of children live in poverty (national average= 21%)
- Unemployment rate for young people higher than rest of UK
- 7% of young people not in employment, education or training
- An increasing life expectancy however, 43% of deaths in 2010 considered premature.

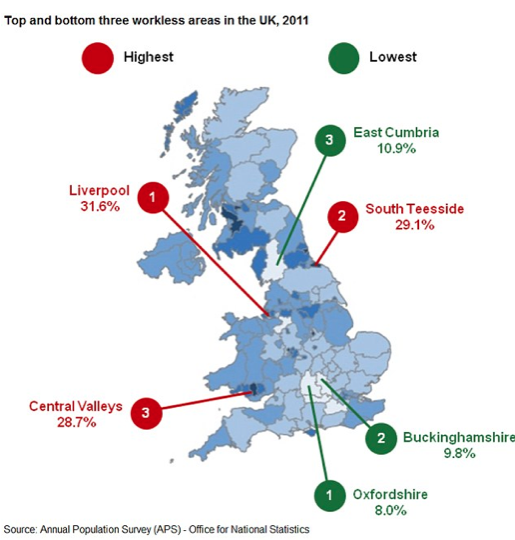
- Examine how changing employment sectors have impacted different areas of the country
- Your answer should include: Workless areas / deprivation / education / health.
IMD
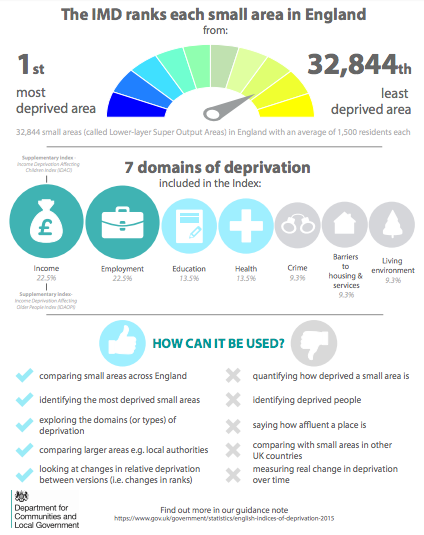
- Explain what the index of multiple deprivation shows and how. Can we link inequality and deprivation to health using data?
- Your answer should include: Domains / crime / health / education / income / employment / living environment / housing.
Inequality
Video on inequality thinking:
These two maps compare ‘good health’ (purple map) and __pay levels __(orange map). 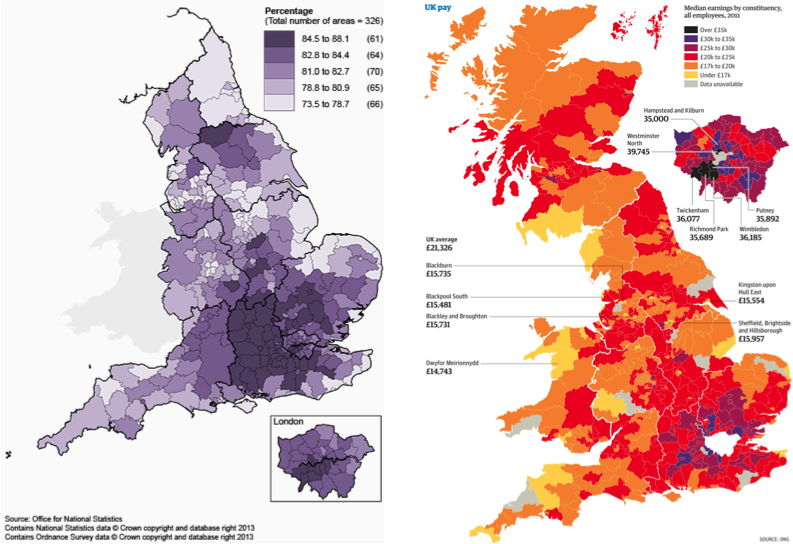
There is a clear pattern, with the darker levels reporting both good health as well as higher pay.
- Especially within London, there is a trend of very high pay (<%50k) and very good health.
The correlation reveals that indices of employment and pay can tell us more than just job status.
__In the UK, the richer you are, the more likely your health is to be good. __