Storm Hydrographs
Cause of Floods
Storm Hydrographs
A storm hydrograph shows variation in a river’s discharge (or channel flow) within a short period of time. It only focuses on discharge during a storm event.
- main purpose = record how a river responds to precipitation.
Base flow-
Before a storm the river’s main source of water is groundwater.
Rising limb on the graph -
Following a period of extreme input (precipitation) into the drainage basin the discharge increases.
Additional input puts the river into storm flow. This input comes from infiltration, throughflow and run-off.
If the discharge breaches the channel capacity a stage called bankfull is reached.
Falling Limb -
Following peak discharge the cumecs of water in the river decreases.
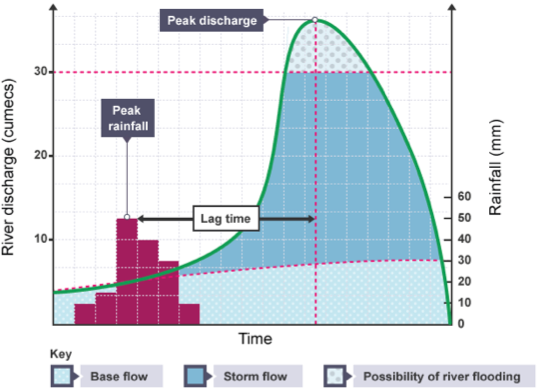
- Name the key features of a storm hydrograph.
- Your answer should include: Lag time / peak discharge / discharge / base flow / storm flow .
Landuse and Flooding
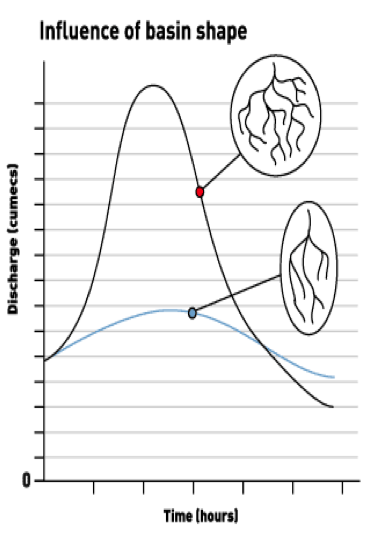
__Size - __
Water takes longer to reach the trunk stream in a large, round basin than in does in a small, narrow one.
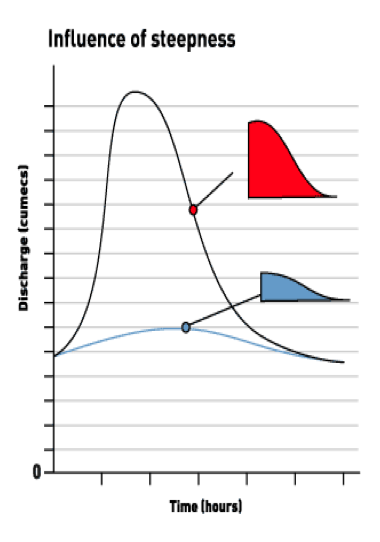
__Topography - __
Where gradients are steep, water runs off faster, reaches the river more quickly and causes a steep rising limb. Prolonged heavy rain causes more overland flow than light drizzly rain.
Similarly to the coastal strategy of SMPs (link to coasts) catchments are starting to be managed as a whole by:
- Considering appropriate land use
- Limiting urbanisation
- Flood management strategies
- Using permeable materials where possible (e.g. car parks)
- Flood proof property design
- What factors influence the shape of a hydrograph?
- Your answer should include: Size / shape / steep / rock types / soil types / vegetation / urban / precipitation / saturated.
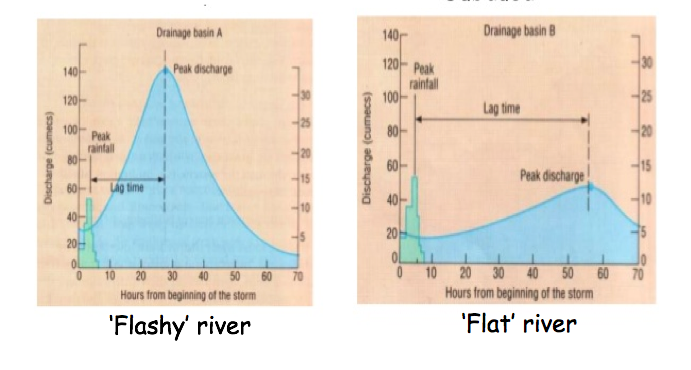
Compare Storm Hydrographs
- Size of drainage basin
larger = catch more discharge
Smaller = shorter lag time as less distance to travel =more flashy.
- Shape of drainage basin.
More circular = shorter lag times and higher peak discharge because water has shorter distance to travel than long and thin.
- Drainage basins with steep sides tend to have shorter lag times than shallower basins. This is because water flows more quickly on the steep slopes down to the river.
Where gradients are steep, water runs off faster, reaches the river more quickly and causes a steep rising limb. Prolonged heavy rain causes more overland flow than light drizzly rain.
- if the rock type within the river basin is:
impermeable surface runoff will be higher, throughflow and infiltration will also be reduced meaning a reduction in lag time and an increase in peak discharge.
And __soil type __ie.
sandy = high infiltration rate
clay = low infiltration rate.
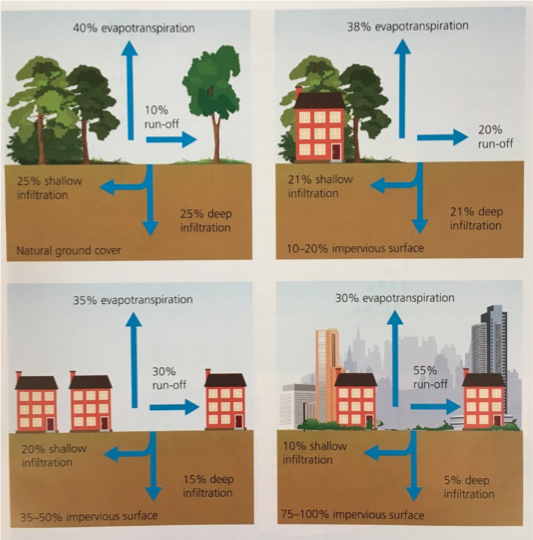
- Vegetation intercepts precipitation and allows evaporation to take place directly into the atmosphere so reducing the amount of water available for overland flow
Large numbers of impermeable surfaces in urban areas encourages run off into gutters and drains carrying water quickly to the nearest river.
-
Amount and type of precipitation (ie. snow takes time to melt = greater lag time).
-
If the drainage basin is already saturated then surface runoff increases due to the reduction in infiltration.
Rainwater enters the river quicker, reducing lag times, as surface runoff is faster than baseflow or through flow.
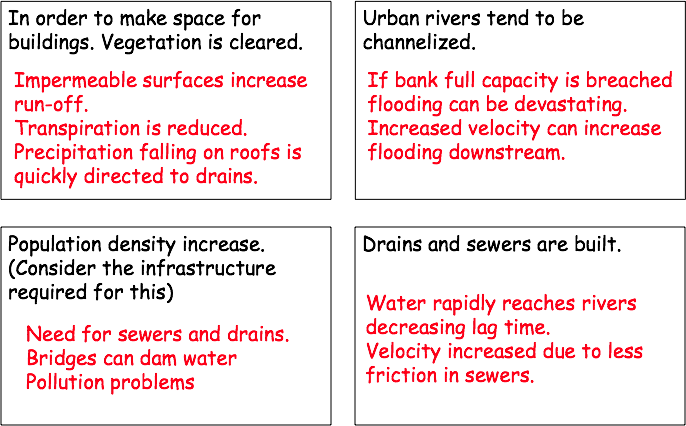
- Examine why urbanisation is so important in influencing flooding and storm hydrographs.
- Your answer should include: Impermeable surfaces / population density / sewers / lag time.