Business Objectives and Pricing Decisions
Economies of Scale
There are ways in which an increase in output can lead to a fall in average costs. These average cost reductions are called economies of scale. If they result from the growth of a single firm, they are internal economies of scale. Often though, competitive advantage is heavily dependent on being able to reap these Economies of Scale. If you can’t reap Economies of Scale whilst competitors can, you will simply lose out. We can group internal economies of scale into a number of categories.
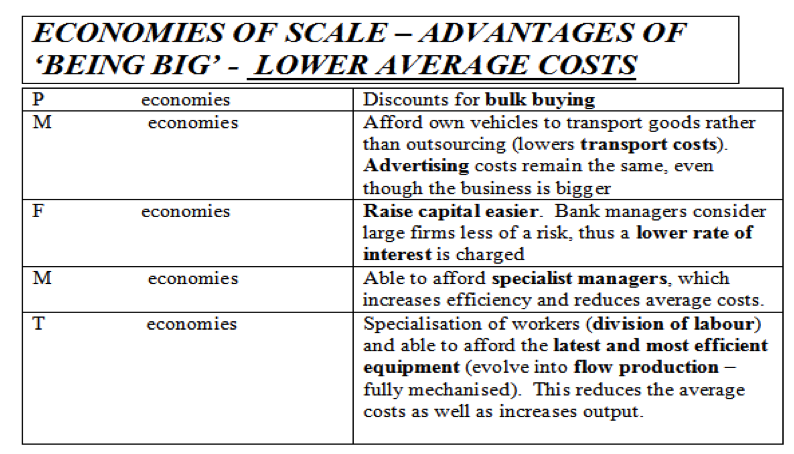
Risk-bearing economies = big businesses with many products/markets are diversified and can spread risk. E.g. Coke is doing well in America, but poor in Asia. Or Diet Coke is selling strongly whilst Fanta is going through a period of poor sales.
External economies of scale
There are ways in which the growth in the size of an overall industry will allow firms in that industry to benefit from average cost reductions. Such cost reductions are called external economies of scale. E.g. specialist suppliers and support industries are likely to develop.
- For example, car component suppliers are found around concentrations of car assembly plants.
-_ _Local education and training providers build up a pool of skilled labour with the right specialism. An example would be, when the Pfizer factory was in Kent quite a lot of science based courses were on offer at the local technical colleges.
External Economies of Scale benefit all of the firms in an industry, reducing their costs. They do not give an individual firm an advantage over local competitors as they will share the same benefit. Quite simply – they are the advantages to a firm of operating in that industry, due to its size, and they benefit everyone in that industry.
Marginal cost and marginal revenue
Marginal analysis enables us to identify the profit maximising output level (when MR=MC – an Economics rule!). Most businesses when working out how much extra to produce, will be thinking about a little more or a little less output…thus marginal analysis – considering the effect of just one more item. Marginal costs and revenues can be found by calculating the change in total costs and total revenues when output increases/decreases by a certain amount.
-
Marginal revenue = change in total revenue of selling one more item of output.
-
Marginal cost = change in total costs from making one more unit of output.
If making and selling one more unit adds more to revenue than it does to costs (MR>MC) then this will be worthwhile. If the last unit adds more costs than revenue (MC>MR), then reducing output will increase profits. Logically, profit will be maximized when MC = MR.
Minimum efficient scale
Do economies of scale go on forever? Over time businesses will suffer from being too big!
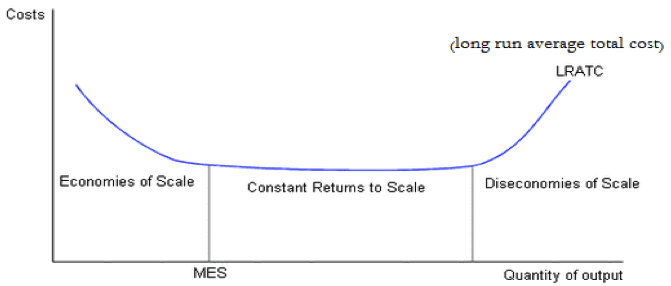

MES is the optimum level of output for production – at which costs are being minimised. At MES businesses can achieve competitive advantage.
E of S will push average costs down as output increases, until diseconomies weigh in and push costs back up! The lowest part of the average total costs (ATC) curve shows the lowest possible average cost. This indicates the best or optimum point in terms of productive efficiency.
The level of output at which the lowest average cost is reached is known as the minimum efficient scale. Reaching the MES is a valuable source of competitive advantage. If rivals are tied to output levels at which their average costs are higher, a firm at MES will clearly have an edge on them! They can undercut them in prices and operate at a larger profit margin and expand further!
Where does this link into 4.1.4? Operating at MES (i.e. minimum average costs) helps profitability. In price competitive industries it is important to reach the size at which average cost is minimised –__ MES__. Firms below this size will have a cost disadvantage.
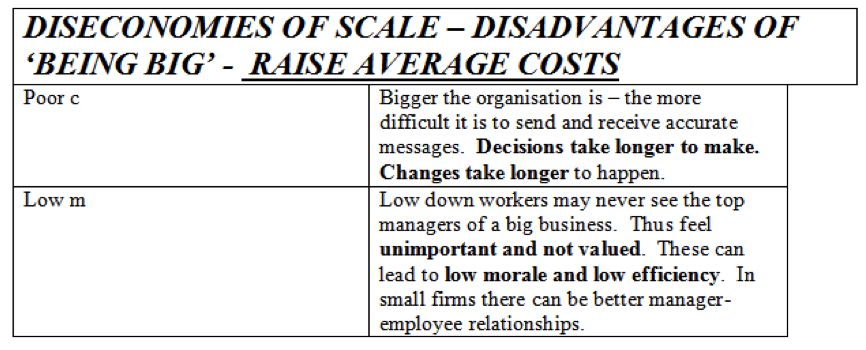
Diseconomies of scale
Economies of scale, market power, strong brands and increasing volume of business can be linked to growth of a business – generating profit and success. Despite this, most businesses are small as bigger is not always better.
Beyond a certain point, increasing size will bring disadvantages rather than advantages and push average costs up. These are called diseconomies of scale.


External diseconomies of scale occur when an industry expands too quickly. Individual firms are then forced to compete with each other and bid up the prices of factor inputs like wages and raw materials. E.g. the ‘app development’ industry recently with the flotation of the likes of ‘King’ company, etc., making programming a well-paid job!
Although diseconomies of scale will see average costs rising - which will affect profitability – there are global oligopolies which stay competitive despite diseconomies. How do they achieve this? They either find ways to counteract the diseconomies or successfully differentiate enough so consumers will pay more for their brands.
Deciding on price and quantity
Continued price cuts with a downward sloping demand curve will eventually lead to a fall in total revenue and negative marginal revenue. PED will vary as we move along the demand curve – the top end will be more elastic drastic responses (higher PED - >-1) with elasticity decreasing as we move along the curve to become more inelastic not so drastic (lower PED – between 0 and -1).
Your _Getting Started Guide _says:
Economic decision making usually relates to what happens at the margin. Typically, firms might be deciding to produce a little more or a little less in response to market changes. Costs will increase or decrease by small amounts as output changes. It pays the business to produce more so long as the extra revenue is greater than the extra cost. Profit will be maximised when marginal cost is exactly equal to marginal revenue. Marginal costs and revenues can be found by calculating the change in total costs and total revenues when output increases/decreases by a certain amount.
MC, MR and contribution
Given the premises, equipment and other fixed costs, moving up from very low levels of output might bring greater efficiency and so less added costs for an extra unit. Fixed costs are spread across the increased output. But if output increases too much, MC may rise if the business encounters bottlenecks, congestion and overtime payments – diseconomies of scale! At this point, producing extra units will push up marginal cost and reduce contribution per unit.
Contribution is defined as the amount each sale raises towards covering fixed costs (i.e. making profits!). Extra costs from one unit of output (=MC) are likely to be variable costs (remember in the short run – FC don’t vary with output. For example: producing one more trainer will not put up the rent!! But it will put the VC of raw materials).
Remember, as long as MR>MC, an extra sale will make a positive contribution towards fixed costs or profits.
Your _Getting Started Guide _says:
Contribution decisions illustrate the significance of the margin. Students should revise section 1.6.2 and consider how a reduced price can increase profit provided that it makes a contribution to fixed costs. Essentially, they are looking at the marginal cost and the marginal revenue of a small increase in output – as long as MR>MC then a positive contribution will be made.
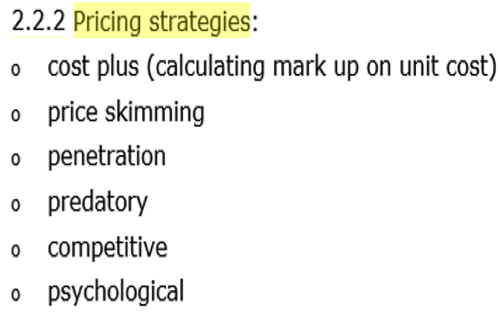
The impact of objectives on pricing strategies
Business objectives can vary – some are focused on survival, others on growth and profitability. Some firms have no choice due to the nature of their market structure – e.g. perfect competition and normal profits. Due to the highly competitive nature of the market and zero barriers to entry, firms operating in such a market must price competitively at the market price in order to survive. This can be a way to make a living, but will not bring great riches.
Going for growth involves building market share by charging lower prices in the short run, so demand increases – i.e. penetration pricing. These prices must be high enough to cover costs but low enough to attract customers in large numbers. This is Sports Direct’s approach! They hope that once market share is significant there may be a degree of monopoly power that opens up pricing options and the potential for greater profit (skimming/premium pricing in due course).
Customer satisfaction, better brand loyalty will increase demand and reduce PED. Focusing on differentiation and marketing might take short run priority over profits. The business will be able to thrive in times of competition as it will have USPs that help provide monopoly power. A better product creates a competitive advantage. Focusing on specific market segments, tailoring the product to their needs may increase profitability.

Ethical priorities, social objectives and concern for employee welfare can in fact be consistent with growth and profitability. A social enterprise or charity offering something useful (e.g. mobility scooters!) might achieve significantly more than the profit maximizing output and be very successful as reputation may attract customers.
Your _Getting Started Guide _says:
For some businesses, growth is an important objective. If their market is not growing, then they must look for a way of increasing market share and pricing may be made more competitive. For others, profitability may be more important and this may involve quite different strategies, possibly concentrating on specific market segments and charging premium prices. Reputation may be a significant objective and the response will be different again.