The AD / AS model
Aggregate supply and demand
Points to consider and note:
-
Often the word ‘aggregate’ appears in football, but what does it mean?
-
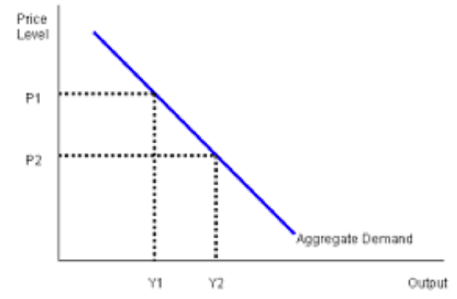
Aggregate demand = The Total Demand from all sources in the economy
-
It slopes down from L to R.
-
What happens to C + I + G + (X-M) during high prices?
-
High prices = low consumption as incomes buy fewer goods/services, gov budgets are tight due to high prices, firms are reluctant to invest and exports are down as expensive.
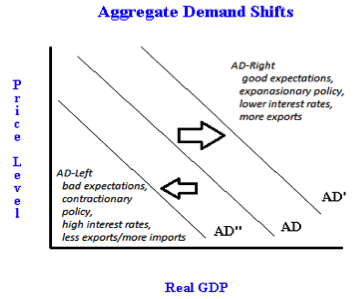
Changes in factors influencing the components of aggregate demand (such as incomes, ER and confidence) will mean a shift to a new curve (SHIFT RIGHT if increases, LEFT if decreases).
Tip: Be careful when labelling your axis!
Aggregate supply:
-
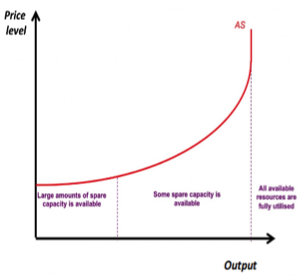
Defined as the__ total__ amount of goods/services that all industries in the economy will produce at every given price level.
-
Any changes in the cost of inputs (such as wagerates), the cost of rawmaterials or the price of imports will alter the amount firms are willing and able to supply thus affecting AS.
-
Changes in productivity (?)/capacity utilisation will alter the AS of goods/services as more can now be produced using the same resources.
-
Anything that can improve productivity (improvements in human/physical capital, technological advances and process innovation) will therefore improve AS and there will be shift of the curve to the right – leading to economic growth.
The interaction of AD and AS curves:
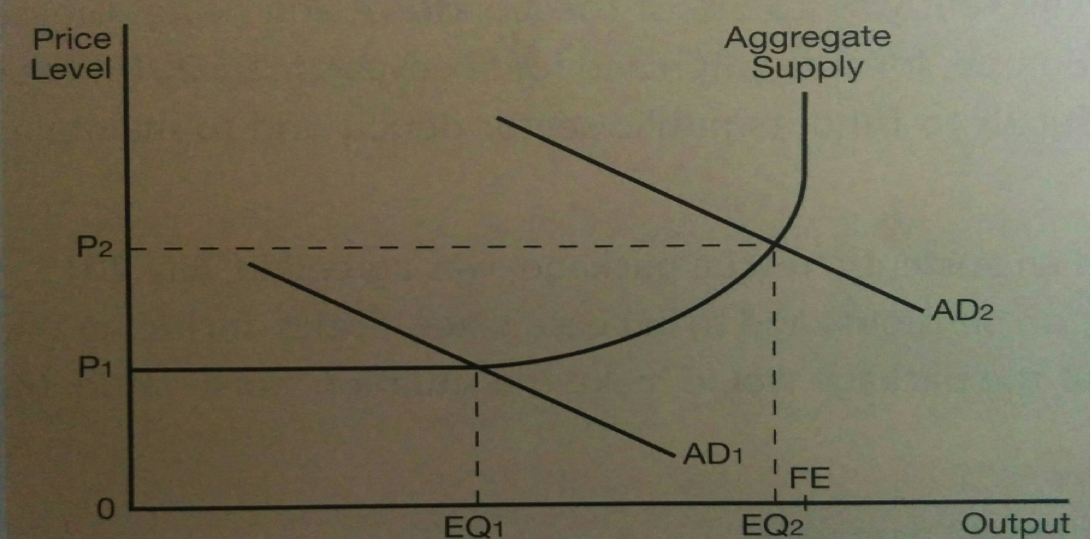
Injections / Leakages
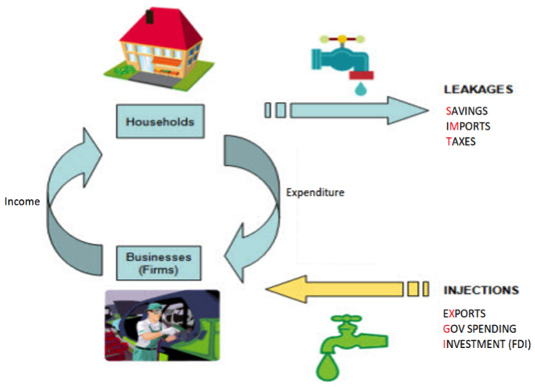
-
Money can leak out from the circular flow, or be injected in by households/business/government. Explain the following and classify them as leakages or injections…..
-
SAVINGS (S), TAX (T), IMPORTS (M), INVESTMENT (I), GOV SPENDING (G) and EXPORTS (X).
Once leakages and injections are added, it is easier to see how activity might fluctuate. Bigger total leakages would reduce the flow (reducing GDP) and bigger total injections would increase it (raising GDP). Both would have an effect on incomes.
Capital utilisation
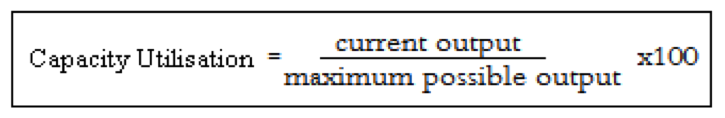
The capacity utilisation formula:
-
Ideal level = 90% (a buffer!)
-
>90% = over-utilisation. <90% = under-utilisation
The difference between full capacity and spare capacity:
-
Full capacity = all resources available are being used to the fullest extent all of the time
-
Spare capacity = for some of the time some resources are not being used and therefore there is a loss of potential output
Implications of under-utilisation of capacity - What are the consequences if capital utilisation is low? I.e. not producing as much as you potentially could?
-
Resources not used, production not as high as it could be. Machinery/workers are ideal. FC shared across a lower level of output and thus AC rise and profit margins squeezed!
-
For an economy/industrial capacity, it is bad news! Not as competitive as it could be.
Implications of over-utilisation of capacity - What are the consequences if capital utilisation is too high? I.e. producing beyond your maximum?
-
Bottlenecks, breakdowns, worker pressure, overcrowding, accidents. All reduce efficiency and raise average costs! E.g. Busy A&E dept on a Saturday night!
-
For an economy/industrial capacity this is bad news! Not as competitive as it could be.
Some ways of improving capacity utilisation; How can we improve under-utilisation of capacity? (i.e. under usage of machinery?)
-
Increase output – produce more to use up spare capacity. However, need to increase demand otherwise you’ll end up with excess supply!
-
Product development (extend product range) or market development (find a new market) can help increase demand.
-
Rent out spare machinery to other businesses! E.g. supermarket own labels ‘rent’ floor space in the Cornflakes factory.
-
Reduce the resources employed to adjust the capacity if under-utilisation is persistant.
How can we improve over-utilisation of capacity? (i.e. over usage of machinery?)
-
Adjust production line to take care of bottlenecks (rationalisation).
-
Applies to management and supply networks – examine the way production is organised. Lean production (2.3.3) looks at this.
-
Waiting list for customers, refuse additional orders or increase prices to reduce demand are also solutions (think of a popular restaurant!).
-
Increase working hours to increase capacity (e.g. Thorntons factory operates 24 hours a day for 3 days in the build up to Valentine’s day!). Overtime is an easy solution.
-
Long term solution is to invest in increased capacity – capital equipment or human capital.
These solutions can fix things not only on a business level, but on an economic level too. Unemployment policies, interest rate policies and fiscal policies (2.5 - Economic Cycle) all help too.
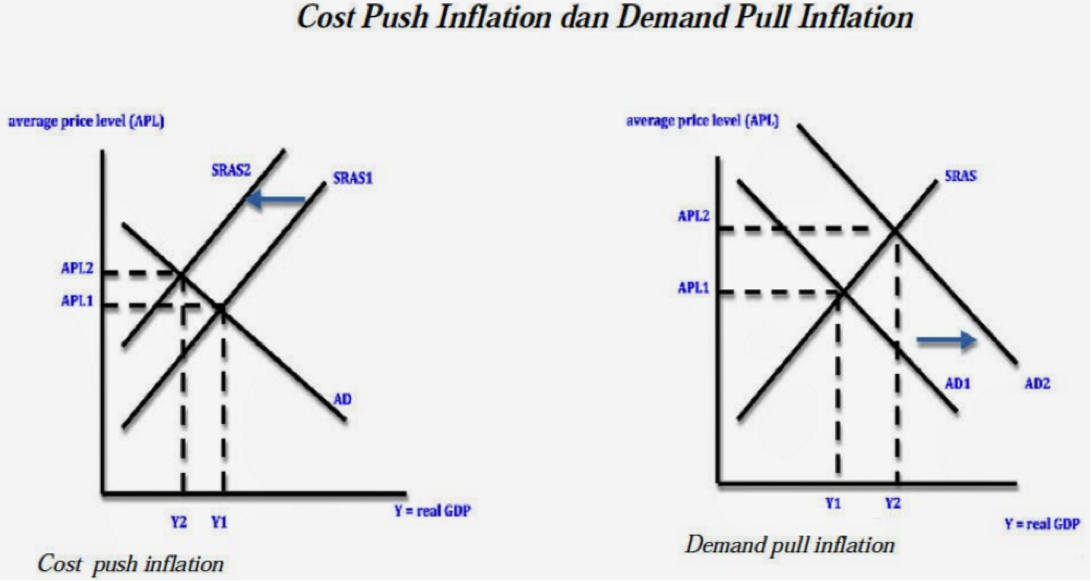
Demand-pull and cost-push inflation
Demand-pull is where a rise in AD in an economy cause a rightward shift and thus price rises. Cost-push is where a rise in business costs, for whatever reasons, makes it more difficult to supply to the market and thus a contraction in AS and a leftward shift and thus price rises.
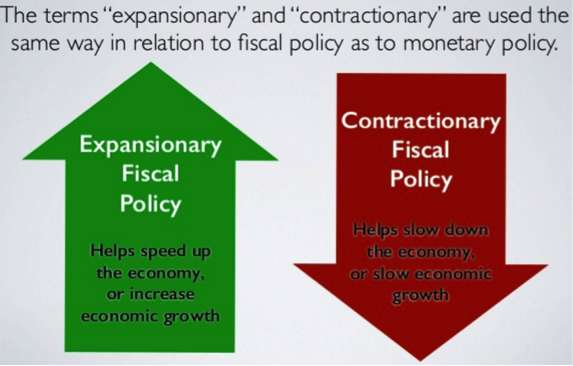
Contractionary and expansionary policies