Inflation and Unemployment
Exam Style Question
Section C 20 marker version 2 – peer planned but independently and fully written:
Greece in trouble
_GDP per capita in Greece was 26,000 euro a year in 2014, 2/3s of the UK equivalent (source OECD). Whilst the UK was in recovery post GFC, output and demand in Greece were still falling. Unemployment was 26.5% of the workforce and rising. Greece has a reputation for corruption and tax evasion. By 2015, the Greek Government found it increasingly difficult to fund its public sector deficit and maintain its position in the Eurozone. _
After tough negotiations a fourth ‘austerity rescue package’ was agreed in July 2015, requiring Greece to cut public spending (e.g. on pensions) and to increase taxes. Critics, including the IMF, felt the package would make the situation worse rather than better.
1. Assess the likely impact of the austerity package on the circular flow of income in Greece (20 marks).
Keywords:
-
Structure = Define Key Term. 2 VS 2 and then a justified judgement.
-
Define main concept = ‘Circular Flow of Money’ in an introduction.
-
Impact 1 = Injections. Take your point but also flip it. Evaluate. Agreeing point VS however point.
-
Impact 2 = LEAKAGES – “
-
Conclusion / Recommendation = What do you recommend? Justify your position.
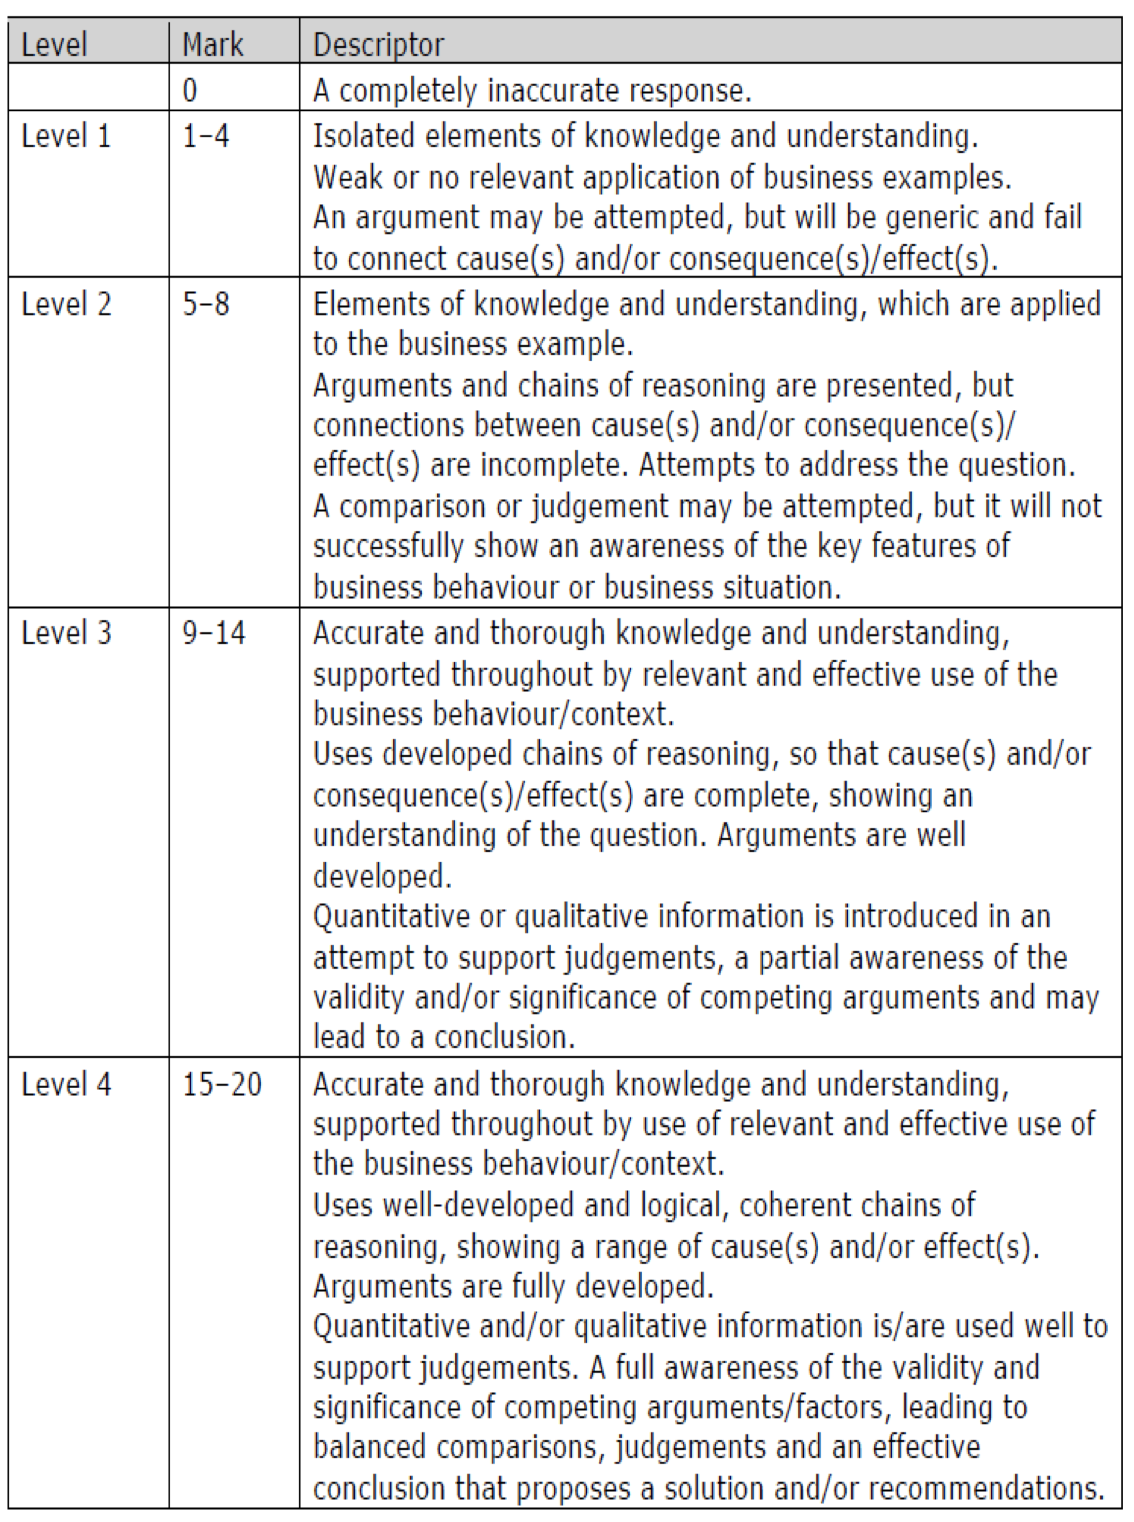
_Standard mark scheme for a 20 Marker can be found below. Make a note of what skills you require to get into Level 4. Structure and exam technique is everything. _
Unemployment
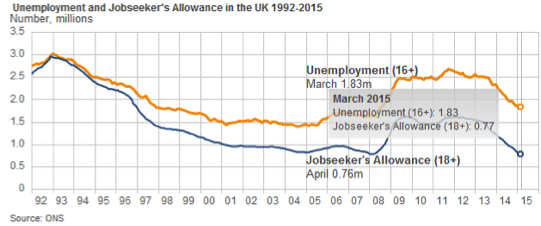
The 2 measures of unemployment: ‘the claimant count’ and the ‘International Labour Organisation (ILO) measure (aka ‘The Labour Force Survey’)
- Claimiant count = those on job seeker’s allowance, i.e. claiming unemployment benefits.
- LFS/ILO = estimates on people out of work and seeking work, but not signed on for JSA thus a higher figure. It’s is clear why the government choose to measure unemployment via the claimant count – it’s a lower figure thus politically better to use.
An outline of the core causes of unemployment:
Structural unemployment: When there’s changing tastes/demand/specialism in an economy, i.e. the economy moves on and leaves some people behind it. A good example is Belfast/Glasgow/Liverpool which used to be ship building hubs, but we are a knowledge based economy now and lots of people in these cities don’t have these skills thus have been left structurally unemployed.
___Occupational immobility: ___When people lack the ability to move from one type of work to another – i.e. lack flexibility in skills.
Geographical immobility: When workers lack the ability to move from one region to another for work – i.e. lack flexibility in geographical location.
Technological unemployment: Occurs when capital intensive labour-saving equipment/techniques reduce the need for labour.
Demand deficiency and cyclical unemployment: Occurs during a recession when businesses are making cutbacks/redundancies in an effort to stay afloat.
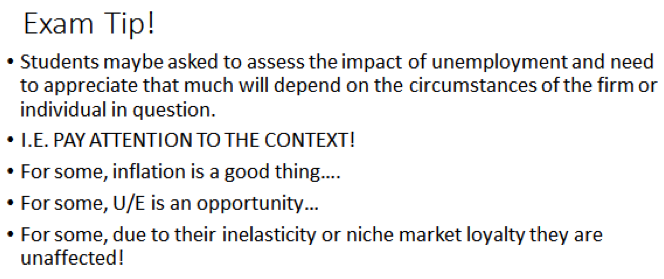
___An outline of the negative impact of unemployment on the individual: ___Rising unemployment makes it harder for job seekers to find work – cutbacks from firms but also fewer vacancies/more competition for jobs. Surviving on benefits is hard (around £75 a week!), thus it affects peoples mental health as well. People who are long-term unemployed lose ‘working habits’ and become ‘deskilled’ as their current skill-set becomes dated – this can cause them long-term issues.
An outline of the negative impact of unemployment on the business: In times of cyclical unemployment firms face making redundancies and bad PR. It’s also harder to make sales in such times – a double edged sword! However the sliver lining is cheaper/easier recruitment as people are willing to take a pay cut or work for national minimum wage rather than above it.
Inflation
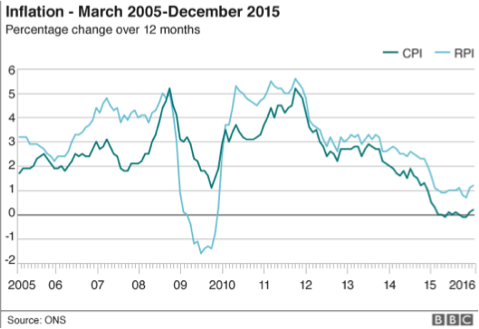
How the price indices (RPI&CPI) work and state the current rate of inflation:
- CPI = consumer price index, a weighted index of typical consumer purchases in a ‘basket of goods’ taken every month.
- RPI = Retail Price Index, works the same but a measure for businesses.
Tip: Look up the current rates and make a note – the examiner loves to see a student who is up-to-date.
Real and nominal values, and constant and current prices:
- Real/constant prices = removed the effect of inflation.
- Nominal/current prices = raw, inflation has not been accounted for.
An outline of causes of inflation: demand pull and cost push
If aggregate demand increases in an economy, the demand curve will shift to the right and prices will increase. If costs increase for a business, aggregate supply will decrease and the curve will shift to the left and prices will increase. Thus we have demand pull and cost push inflation!
An outline of the negative impact of inflation on a business: uncertainty and loss of international competitiveness.
Inflation causes uncertainty amongst business and uncertainty amongst customers – both parties get nervous as high inflation is the sign of a troubled economy and both parties start to sit on their money rather than spend it! This reduces the circular flow of income and thus can have a very negative impact on businesses, affecting their international competitiveness as well with high prices.
An outline of the negative impact of inflation on individuals: loss of real income and the effect on savers (but benefit to borrowers!.
As previously stated, customers/employees lose out with high inflation. If you get a wage rise of 5% but inflation is at 3% then your real/constant pay rise is actually 2%.
Thus high inflation can reduce disposable incomes and particularly hurt those on fixed incomes – such as pensioners or people on the minimum wage. However with high inflation it means that money is losing its value and if you are a borrower this is good news!
However if you are a saver this is bad news as prices are rising (inflation) beyond interest rates on your savings which means that your money is worth less.
