Circular Flow of Income, Expenditure and Output
The circular flow of income, expenditure and output
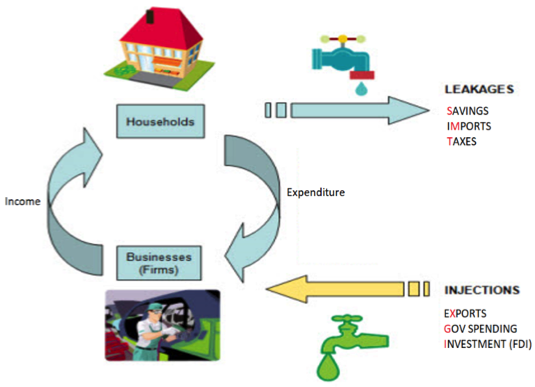
Factors of production and money flows
There is therefore a two-way relationship between firms and households in the economy. Most adults work for a business (even if self-employed) and thus provide labour in return for payment. Others may own savings (which earn interest) or shares (which yield dividends) or land/property (from which they receive rent). These factors of production (labour, capital & land) are all sources of household income (salaries/interest/dividends/rent).
What do people do with this income? They spend it on goods/services from businesses. Money flows backwards and forwards between households and firms.
The relationship is vital in economics, and more complicated that it initially seems. Money can leak out from the circular flow (savings, imports and taxes), or be injected in by households/business/government (exports, government spending and investment). Once leakages and injections are added, it is easier to see how activity might fluctuate. Bigger total leakages would reduce the flow (reducing GDP) and bigger total injections would increase it (raising GDP). Both would have an effect on incomes!
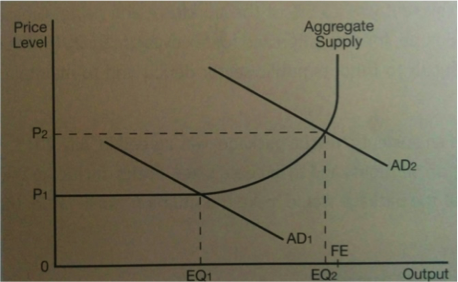
The interaction of supply and demand
When we put AD and AS curves together, we get a picture of the current state of economic activity. Low AD might be linked to limited inflation and high U/E. High levels of AD will push the economy towards working near its full capacity, but often at the risk of accelerating inflation too fast and an unsustainable economy.
Aggregate Supply
Defined as the TOTAL amount of goods/services that all industries in the economy will produce at every given price level. Any changes in the cost of inputs (such as wage rates), the cost of raw materials or the price of imports will alter the amount firms are willing and able to supply thus affecting AS.
Changes in productivity will alter the AS of goods/services as more can now be produced using the same resources. Anything that can improve productivity (improvements in human/physical capital, technological advances and process innovation) will therefore improve AS and there will be shift of the curve to the right – leading to economic growth.
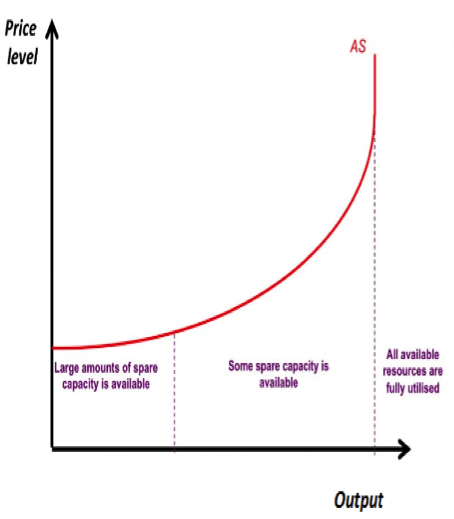
The AS curve shows the link between the general price level and total output, plotting the total quantity of goods and services businesses and others in the economy are willing to supply, against the general price level.
At low output levels (spare capacity, idle resources, bad productivity) we can expect AS curves to be at or near the horizontal. At the other extreme, when output is close to full capacity nearly all resources are in use. Firms simply can’t supply more and AS curve will be near vertical (bottlenecks will arise in some sectors of the economy and thus we will see a curve rather than a perpendicular line! Often these bottlenecks will be caused by skill shortages (2.1.4 – digital skills).
Supply constraints = when demand for scarce resources increases, forcing prices upwards. These include people with scarce skills (labour), natural resources that have a finite supply (land & commodities) and financial resources.

Aggregate demand
Defined as the total spending on goods and services in an economy, in a given period of time at a given price level.
It is made up of consumption (C), investment (I), government spending (G) and net exports (X-M). Often the following formula is used: AD = C + I + G + (X-M)
The economy is said to be in equilibrium when leakages are exactly equal to injections. Thus no extra injections are there to add extra spending power and encourage economic growth, and no extra leakages are there to cause demand to fall/GDP to shrink.
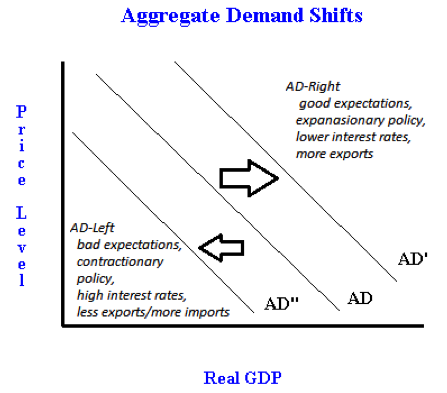
The AD Curve
We can represent aggregate demand (and its component parts) collectively and graphically on an AD curve, linking levels of economic activity with the general price level. It slopes down from L to R. High prices = low consumption as incomes buy fewer goods/services, gov budgets are tight due to high prices, firms are reluctant to invest and exports are down as expensive.
Changes in factors influencing the components of aggregate demand (such as incomes, exchange rates and confidence) will mean a shift to a new curve (right if increases, left if decreases).
Tip: Be careful when labelling your axis!