Productive and Allocative Efficiency
The significance of the margin
Marginal analysis is assessing the potential benefits of an activity compared the costs of it. It is used in everyday life and is one of the main aspects of economic decision making. Firms use marginal analysis to calculate whether it is worth producing another good or not. A trade off is when having more of one variable results in having less of another. E.g. Guns and Butter.
It is broken down into two aspects; marginal cost and marginal benefit. These are weighed up against each other and firms decide based on whether the revenue gained from producing this extra unit outweighs the costs. When marginal costs (MC) is equal to marginal revenue (MR) then a firm is said to be operating at allocative efficiency. Firms may also use marginal analysis to predict the financial returns of two potential investment projects. If they only have the resources to do one of them then marginal analysis can help them pick which one to pursue.
Over time people change their tastes and therefore firms must respond to the market’s needs. In the past consumers may have wanted one thing but now they no longer want it, the firms must alter their level of production to meet this new, lower, demand.
A real-life example of this in action is Newspapers. Ten years ago they used to be read every day in most households, now they are consumed significantly less due to the emergence of mobile news apps. Firms who produce newspapers, e.g. The Times, The Mirror, Daily Mail etc., have had to respond to this and find a new allocative efficient output and cut back on their output and find a new allocative efficient output.
Another example involves Marks and Spencer CEO Steve Rowe saying that the reason that their clothes sales has gone down is that customers now are, on average, gaining less utility than the cost involved of buying the clothes, this leads to poor sales.
Getting Started Guide:
Decisions usually have an opportunity cost (section 1.1.1); there may be trade-offs. At the margin, consumers may decide whether to buy more meat or more fish. If there is increased demand for meat, prices will rise and farmers may respond by increasing the size of their herds. Governments may be forced to choose between spending more on care of the elderly or more on education of the very young. Resources are finite and, for allocative efficiency, the choice made must be the one that most closely matches consumer preferences.
Differences
__Allocative Efficiency __is about making the best choices on what to produce. The free market, when guided by the ‘invisible hand’ can help generate allocative efficiency. For example, if there is a change in taste which creates more demand then price will rise which would increase profits signals to other firms to enter and existing ones to increase their outputs. Resources will be relocated to meet consumer demands and all of this can be the reverse.
Productive Efficiency, on the other hand, can be used by firms with monopoly power to reduce output below ideal levels so they use fewer resources but charge higher prices. Negative externalities and irrational choices are ignored e.g. tobacco. Free markets will be unfair and have uneven income distribution giving the rich most income so resources are used for them while others are in poverty.

Getting Started Guide:
Productive efficiency is all about getting the best possible standard of living from the resources available. It involves minimising production costs, strategies such as lean production and/or more effective management techniques. Allocative efficiency is completely different, referring to the extent to which resources are allocated in a way that best meets consumers’ preferences. If businesses respond effectively to changes in consumer demand, there is allocative efficiency.
Example Question 1
Outline how market orientated businesses match production to consumer preferences and thus enjoy success:
Market orientated businesses emphasise on non-price competition and using the strength of their brand and marketing to promote and persuade people to buy an innovative item. Even established strong firms fail to persuade, Eg Coca cola launched Dasani water(tap water with added minerals found to be containing a cancer causing agent)
Normally, firms spend extremely large amount of money on developing and launching a product. If that impressed consumers, their profit will increase. The more consumers value a product, the more profitable it is likely to be. On the other hand, if they fail, they will end it up using less scarce resources in production. For that reason, fit is a key for firms to put effort on proper market research before they start their new project.
Appropriate market research will lead to a gradual improvement in the specifications and performance on products. Consequence they get from this, is that they could deliver right allocative efficiency, which means consumers can get the products at relatively reasonable price with an impressive quality.
Getting Started Guide:
The market system creates incentives for businesses to create products that maximise consumer satisfaction. The more successfully they meet their customers’ preferences, the more profit they will be able to make. Markets that function well in this way enhance allocative efficiency. Market-orientated businesses help to make this outcome more likely.
Increasing Productivity
Productivity is measured in terms of the rate of output per unit of input.
New technologies and capital investment improve labour productivity. BMW use a body press making 17 parts a min, and works for 138 hours a week, the equivalent to 3 workers.
Technological innovation such as the 3D printer has changed the ways goods are produced which often improves labour productivity.
The labour force itself is getting smarter due to increase in training as education. This increases productivity because it means that people are less wasteful and efficient. Managers need to keep their employees happy and motivated because a if the employee gets bored then they are less productive.
Example: the UK
Britain has one of the lowest productivity levels in the world.
UK is currently investing in digital and physical infrastructure and £13m support fund to improve management skills.
Getting Started Guide:
Productive efficiency leads to higher productivity (section 2.3). Technological change, training, education and more efficient management can all lead to significant reductions in production costs. The quality of the product may improve too, giving it more value.

Example Question 2
Comprehend how markets interact with each other – suppliers/components affecting retailers (i.e. supply chains), substitutes and complementary products:
Markets are always interacting with each other, buying and selling from one and other. The interaction of a markets can be a bad thing because when an economic shock occurs such as Brexit. Due to the low pound which occurred due to the EU referendum companies like Toblerone had to change the shape of there bars to reduce the weighting costs so they remain completive. This also occurred with marmite and other house hold items some even said they would raise prices by 12% due to the weak pound following Brexit.
Early in a supply chain there are intermediate goods markets, these are markets where firms trade materials and components. So to then make a final product uses lots of different markets to supply all of the different parts that make up that product, therefore linking lots of the markets together which will make them interdependent with one another.
Competition with regards to price and specification needed allowing market forces to work here. Because of this highly competitive market it means that firms are more allocative and productively efficient in order to reduce price as much as possible, this will also mean that the best price is got for the components and this makes the final product cheaper or better. An increase in demand for the final product will mean that there is an increase in the demand for the components effecting other market suppling this one.
The market here are highly interdependent and firms would then be influences more by other substitute and commentary products. Changes in just one of these markets will have a great effect on all of the others and can ripple through the economy. An example of this is the effect that Brexit has had on the UK and business that provide goods, like Toblerone.
Getting Started Guide:
Many of the inputs used in a production process will be bought in from other firms. So if a maker of vehicle components becomes more efficient, prices may become more competitive and that will help the vehicle manufacturer to cut costs too. Markets also interact where there are changes in costs and prices of substitute and complementary products.
Exam Style Questions
It’s Tough Out There
Evidence A: Tesco: rise and fall
Tesco’s rise to seize more than 31% of the UK grocery market (by 2008) came from two sources. The first was its vast investment into new supermarkets and hypermarkets. Annual £multi-billion investments were financed increasingly by the credit taken from suppliers. Daily sales would bring in huge amounts of cash – and delays in payments to suppliers would keep a permanent cash fund measured in billions that could be invested in new stores. Just as banks use short-term deposits as the basis for financing long-term loans (risky!), the growth of Britain’s supermarket chains used the same approach.
But Tesco used another approach to meet its objective of growth – takeovers. This is how it built up its convenience store chain. It purchased T&S Stores (850 outlets), Adminstores (45 stores in London) and, later, 21 stores and petrol stations from Morrisons. And when the Office of Fair Trading looked at these takeovers, it accepted Tesco’s argument that the UK grocery sector should be split into ‘supermarket/hypermarket’ and ‘convenience’. So the OFT (now part of the Competition and Markets Authority) allowed a company with more than 25% of the UK grocery sector to buy up convenience store chains. Later, Tesco built more of these stores, so that today they have a 25+% share of both sectors.
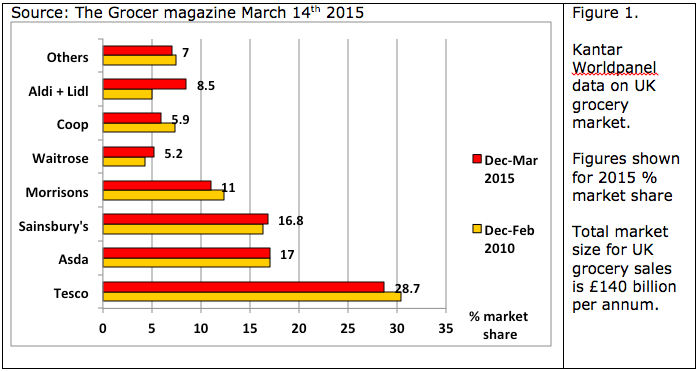
But while pressure groups such as ‘Tescopoly’ (www.tescopoly.org) complained about the growing power of the UK’s Number 1 grocer, ‘the market’ was doing its work. This came in two forms. First, Tesco itself started to make the mistakes that come from a powerful position. Its ventures into China and – especially – America were calamitous. And at a time when Sainsbury’s was recovering from years as an also-ran, there was also a new vigour behind two German discount retailers: Aldi and Lidl. Rarely has a market share growth from 5% to 8.5% had such an impact on trading conditions.
Between 2010 and 2015, Tesco lost 1.7 percentage points of market share, Morrisons lost 1.3% and Coop 1.5%. The growth of Waitrose from 4.3% to 5.2% market share makes up most of the difference in the numbers. Ten years ago, the growth of Tesco was the factor squeezing the smaller grocers – forcing Morrisons to merge with Safeway stores (a bit of a disaster) and Coop to buy Somerfield stores (a fully-fledged disaster). When Coop bought Somerfield in 2009, its chief executive boasted that they’d ‘doubled market share from 4.5% to 8%’ to become one of the ‘Big 5’ grocers. Since then its market share has slumped from 8% to 5.9%.
And what of the future? Currently the press is talking up Tesco’s prospects, suggesting that its market share is recovering. Asda, however, claims that Tesco is buying extra sales by pushing out coupons that offer £10 of groceries for £9. With average net profit margins in grocery retailing of less than 5%, this surely cannot continue. Is it possible that Tesco is trying to push Morrisons over a financial cliff? Surely Tesco wouldn’t be that predatory.
Evidence B: Morrisons
On March 11th 2015 Morrisons reported its worst profits for eight years, with profits down 52% to £345 million. With a write-down of £1.3 billion in the value of its property, its overall loss for 2014 amounts to £792 million. More surprising was its announcement that twenty-three of the recently opened ‘M’ convenience stores are to be closed, with the loss of 380 jobs. It also says its roll-out of the M stores will be slowed down significantly. Quite simply, Morrisons has entered this market too late. Sainsbury and Tesco have all the best urban sites.
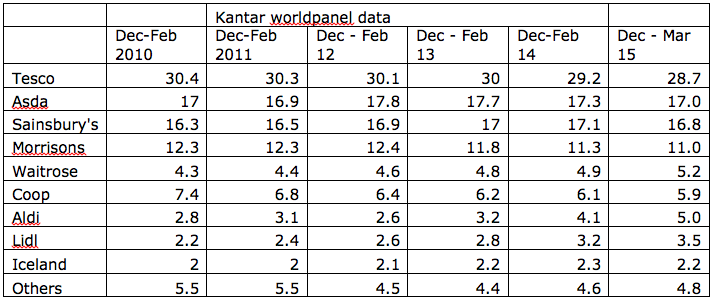
Evidence C: Market share data: 2010-2015
Questions (30 marks; 35 minutes)
-
Explain how Tesco could use its monopsony power to generate cash. (4)
-
Explain how the four-firm concentration ratio can help define the market structure as an oligopoly. (4)
-
Using Evidence C, calculate the percentage change in the market share of The Coop and of Aldi between 2010 and 2015 (4)
-
Discuss two reasons why a business such as Tesco or the Coop might choose to grow by means of takeover or merger. (8)
-
Some analysts have suggested that 2015 should mark an all-out attempt by Tesco to restore its position as unrivalled market leader. Assess strategies that Tesco could use to achieve this objective. (10)
Answers
Key concepts for Q1
Monopsony is when there’s a monopoly buyer for a product or service.’ In this case it applied to the lengthy credit periods that Tesco demanded from its suppliers. By delaying payments, Tesco could hold on to cash for a longer period and use it to help it expand.
Key concepts for Q2:
-
With four firms holding a market share of nearly 75%, the market would have to be described as an oligopoly (competition between the few), though Tesco’s market share can also be termed a monopoly as it exceeds 25%.
-
Interestingly the 4-firm concentration ratio in 2010 was 76% and in 2015 is 73.5%, so there has been some market share loss for the oligopolists. This is due to the breakthrough by the Lidl/Aldi discounters, plus the rise of Waitrose.
Answer for Q3:
Coop: 5.9-7.4/7.4 = -20%
Aldi: 5-2.8/2.8 = +79%
Key concepts for Q4:
-
From the text it’s clear that both Tesco and the Coop had growth at the heart of their business objectives. In Coop’s case that may have been part of a desire to survive (based on the assumption that a near-doubled market share would increase the company’s capacity to benefit from economies of scale); in Tesco’s case the gigantism seems to have been for its own sake; when a growth objective is governing decisions it’s understandable to look to a takeover as a way to get to where you’re aiming at the stroke of a pen. (In a phrase once used by a credit card, takeovers ‘take the waiting out of wanting’.)
-
For the Coop, as mentioned, a focus would have been bulk buying, greater technical economies and perhaps greater managerial (specialisation) economies of scale. In fact a look back at the chief executive’s boasts at the time of the takeover shows that he saw it as meaning much more. He wanted growth for growth’s sake, seeing 8% market share as a goal in itself – rather than as a means to an end. In takeover and merger situations the principal-agent problem is never far away. Here, Peter Marks (Coop boss) seemed all too thrilled by the publicity itself (I’ve made a ‘successful’ takeover bid therefore I’m one of the big boys.)
-
For Tesco the takeovers were more rational; in effect they had saturated the market for super and hyper-markets; now it was time for a new strategy – taking Tesco into every high street with smaller urban shopping spaces. Since 2010 this has been one of the few growth sectors in grocery retailing
Key concepts for Q5:
-
The most obvious is a price war. Of all its rivals, the only ones with deep pockets are Asda (owned by Wal-Mart), Aldi and Lidl. Morrisons, Coop and Waitrose have all suffered from takeovers/growth funded by debt. For Tesco to successfully execute a predatory pricing policy (ie deliberately seeking to damage its rivals), it would need to be remarkably clever. If politicians or the public became convinced that a short-term price war was to be followed by a brutal Tesco dictatorship (in the grocery sector), the anti-Tesco sentiment might overwhelm the business. Subtlety would be the key word. But subtlety is possible. An all-out attack on fresh food prices would be hard for politicians to argue with (as compared with cheaper Frosties or caramel doughnuts).
-
Ultimately, predatory action works best when your cost level is below that of your competitor, so that your pricing strategy forces the rival to sell below their costs while you’re still selling at a profit (though probably a slim one); with Tesco’s scale, this seems perfectly plausible. At the heart of price war is the theory of the kinked demand curve, i.e. that price cuts force competitors to follow suit (though price increases do not). It is those price cuts that wreak havoc with rivals’ profitability.
-
A second option would be to use non-price competition. Tesco has an attractive way to achieve that as well. It’s the leading online grocery seller and therefore could put pressure on all the other grocers by putting a substantial marketing campaign behind Tesco Online. If it could boost online sales at the expense of others, it would put significant pressure upon them.
Definition
__Allocative Efficiency: __Producing goods and services to an output that maximizes total economic welfare (satisfaction and consumer preferences). Allocative efficiency is theoretically reached when no-one can be made better off without making someone else worse off. Furthermore a product or service is said to be allocative efficient when the price is equal to the cost of production or the market cost is equal to the marginal cost of supply.
__Productive Efficiency: __ The level of production at which there is minimum wastage of resources whilst costs are also minimised to produce as much as possible from the available resources. Show on the production possibility curve, this is the level at which a country can only produce more of one good or service if it produces less of another as all available resources are in use.