Demand and Supply
Supply curve
SUPPLY– the amount of a good or service that producers are willing and able to supply at a given price, at a given time
There is also a relationship between price and quantity supplied. This is usually a RECIPROCAL RELATIONSHIP; as one changes so does the other, in the same direction. Let’s think about it logically….using our props and considering Cornflakes once again!
| When P increases | Supply increases |
| When P increases | Supply decreases |
This relationship can be shown on a diagram called a supply curve. The s__UP__ply curve slopes UP from left to right.
Movement along a supply curve…
A movement along a supply curve = a change in price
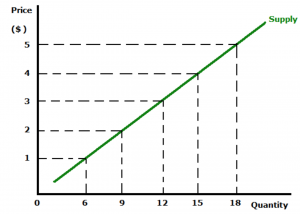
When the price decreases from $5 to $2 there is a movement along the supply curve and the quantity supplied decreases from 18 to 9 units.
Lower prices mean that producers are less inclined to produce for this market. Higher prices mean bigger profits and are an incentive to produce and sell more.
Demand & Supply
Buyers: __people who want to purchase something. They create __demand for goods and services.
Sellers: __people/businesses that want to sell something. They create the __supply of goods and services.
Markets can be real (street markets) or virtual (internet/eBay – lots of potential), small or global. Their key characteristic is that buyers and sellers follow their own interests in relation to price and quantity. Whenever someone has something to sell, and someone wants to buy that product – a market is in effect.
__Demand: __the amount of a good or service that people are willing and able to buy at a given price, at a given time
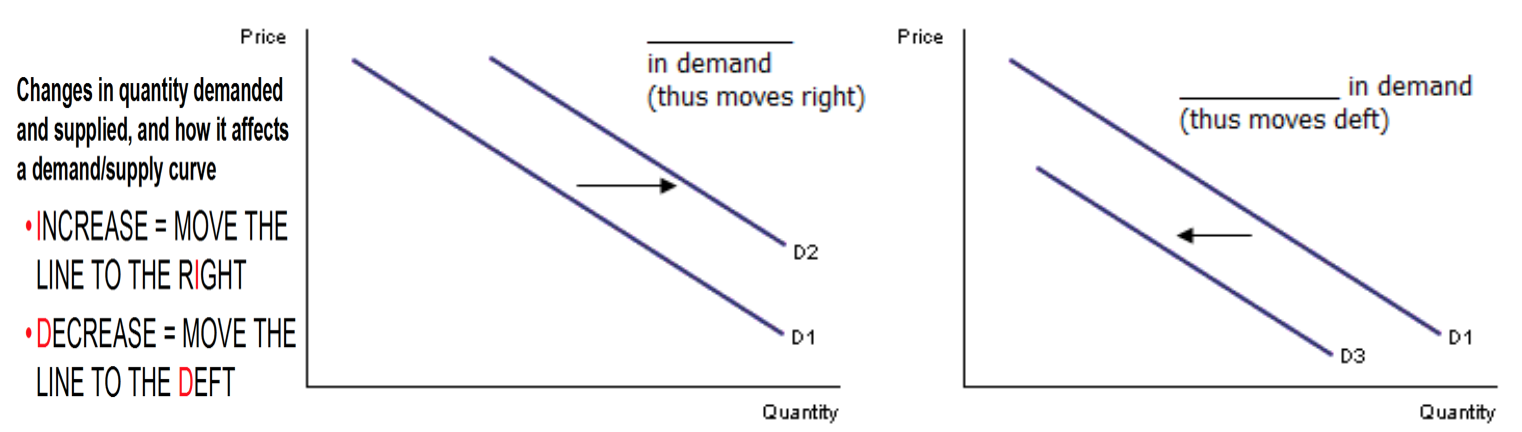
A shift of demand
There are a number of factors that will alter the level of demand – thus causing people to buy more or less of something. This has the effect of shifting the demand curve to the d__eft (__d__ecrease) or to the r__i__ght (__i__ncrease). __A change in demand is caused by a change in a factor other than price.
1. Changes in taste/fashion – these change all the time, as fads come and go. If preference for cornflakes increases, the demand curve shifts to the right. If they go out of fashion and quantity demanded drops, it shifts to the left.
2. Advertising – the whole purpose of advertising is to increase sales! I.e. to increase demand and thus shift the curve to the right.
_3. Changes in populati_on – as population increase/decreases so does demand. In addition if the structure of the population changes so does the demand for certain goods and services. Can we think of an example service??
4. Changes in income – for most goods/services, as income rises so too does the quantity demanded. As income drops, so too does the quantity demanded (reciprocal). These are called normal goods. With some goods/services the relationship is inversed – these are called inferior goods. E.g. cheap substitutes such as Tesco own brand. This has indeed happened during the recession.
5. Changesin the price of other goods:
- Substitutes – goods that can be consumed in place of one another. For example if the price for Weetabix were to increase, people would buy Cornflakes instead of Weetabix and Cornflakes demand would therefore increase – shifting the demand curve to the right. What would happen to the demand for Kenco if Nescafe’s prices were slashed??
- Complements – goods that are normally consumed together. For example if the price for milk was to increase, people would subsequently reconsider buying cereals. Thus demand for Cornflakes would drop, and the demand curve would move to the left. What would happen to the demand for computers, if computer software prices fell??
The interaction of demand and supply
People will only buy a product if they can afford it and they think it represents value for money. Businesses will only sell products if they can make a satisfactory profit on it, in order to cover costs. Thus getting the price right is therefore a significant factor in the success of a product. The price at which a product is sold is therefore influenced by the demand for and supply of the product (factors such as competitors prices also influence).
When we put both the demand and supply curves on the same diagram, there is a point at which they cross. This is the equilibrium point – also known as the market price/market quantity. At this point quantity demanded is the same as the quantity supplied. At this price – there will be no unsold stocks. This is the price and quantity set by market forces.
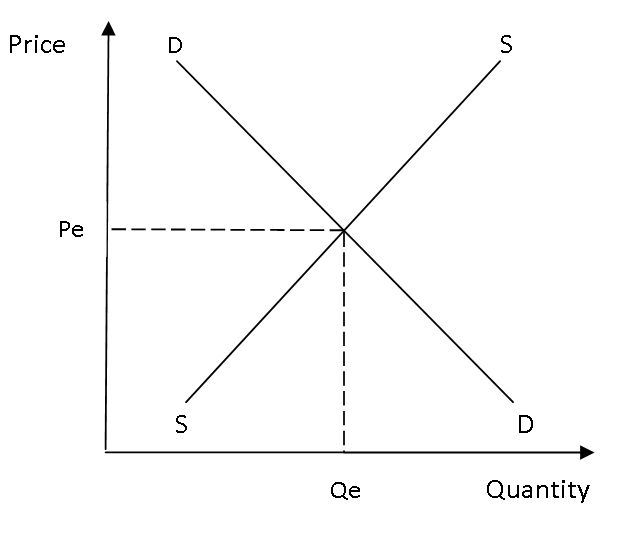
Here the equilibrium point is displayed where supply (S) and demand (D) intersect. This creates the market price (Pe) and market quantity (Qe).
What should firms supply?
Market demand refers to the sum of all individual demands for a particular good or service (customers not only have to WANT something….they have to be prepared to pay its PRICE).
| When P increases | D decreases |
| When P decreases | D increases |
So there is a relationship between price and quantity demanded. This is usually an INVERSE RELATIONSHIP; as one changes so does the other, but in the opposite direction. Let’s think about it logically….using our props and considering Cornflakes!
This relationship can be shown on a diagram called a demand curve. The D__emand curve slopes __DOWN from left to right.
Demand curve
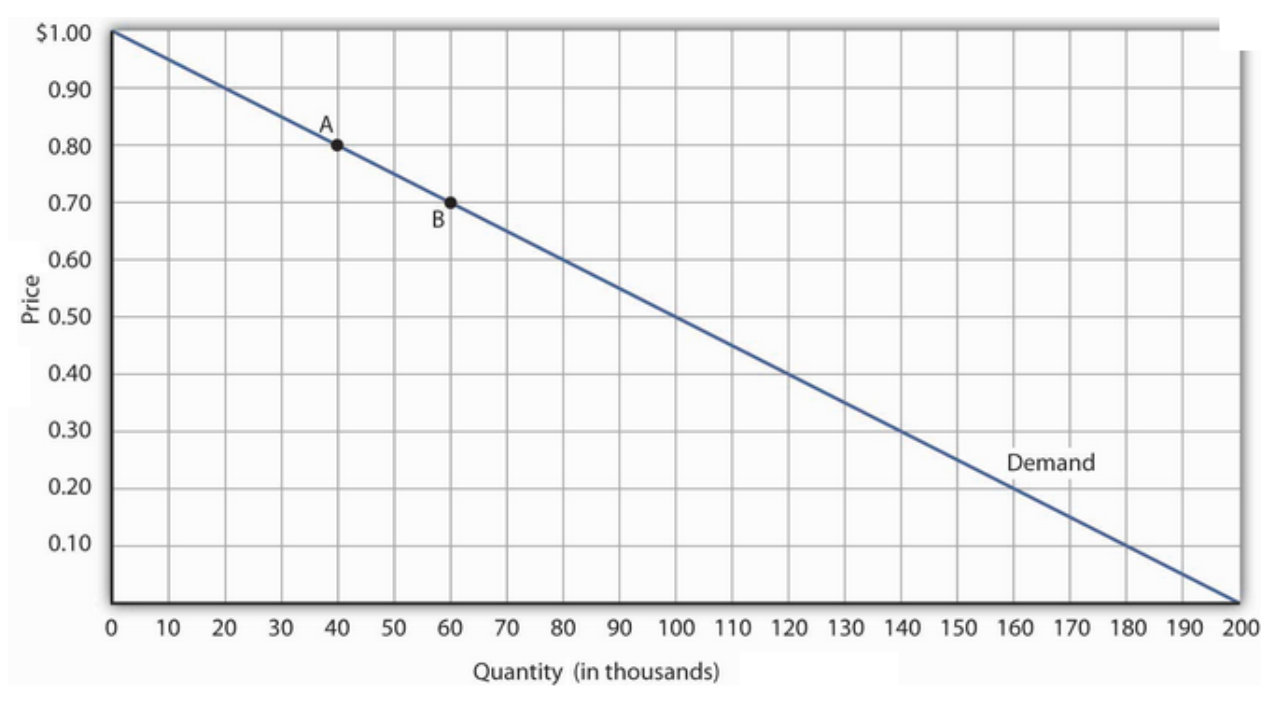
A movement along a demand curve is a change in price.
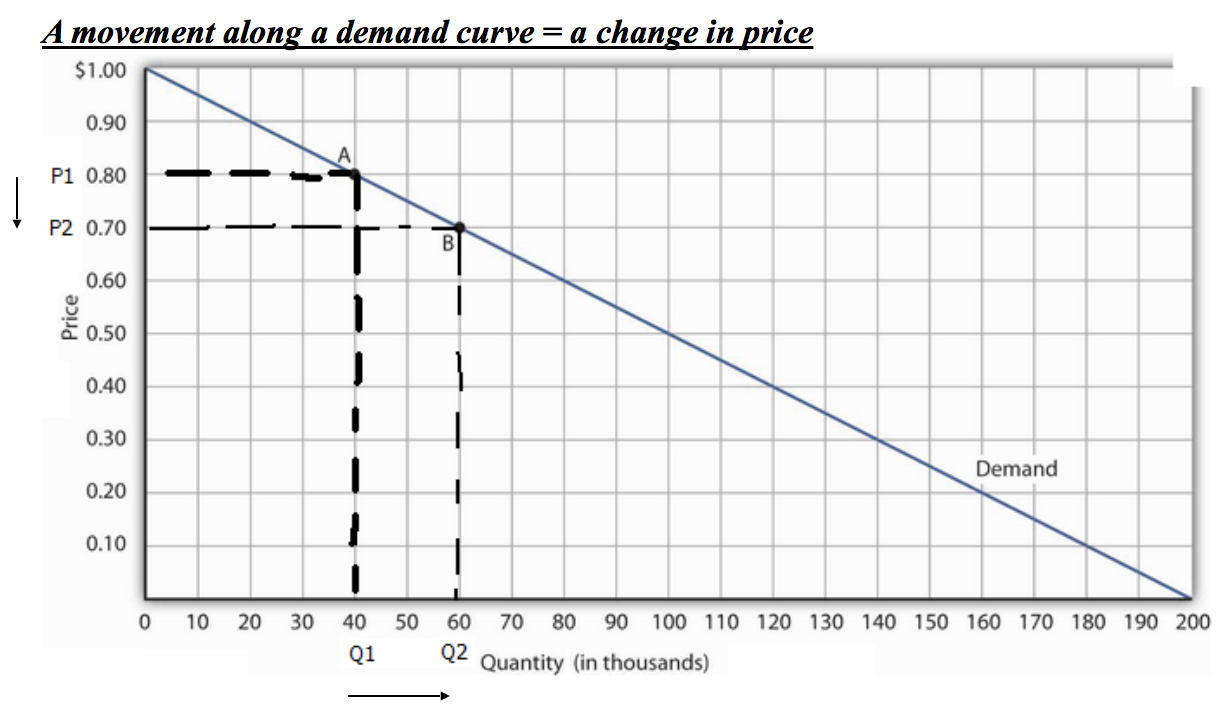
When the price decreases _from P1 to P2 there is a movement along the demand curve and the _quantity demanded increases from Q1 to Q2.
A shift of a supply curve
There are a number of factors that will alter the level of supply – thus causing people to sell more or less of something. This has the effect of shifting the demand curve to the d__eft (__d__ecrease) or to the r__i__ght (__i__ncrease) [SAME GENERIC RULE!]. __A change in supply is caused by a change in a factor other than price.
What causes a supply curve to shift?
-
Changes in costs – An increase in costs will mean a decrease in supply – thus the curve will shift to the deft. Less attractive profit opportunities will mean that a producer will reduce output, thus reducing supply and shifting the curve left. On the contrary, if costs decline, production will increase – supply will increase – the supply curve will shift to the right! Technical changes are a very important reasons why costs fall (efficiency). For example, a furniture manufacturer…..
-
Natural phenomena – there are sometimes events beyond the producer’s control – e.g. wheat or corn is reliant on a good harvest. A poor harvest will send the curve to the left. The discovery of new oilfields will shift the curve to the right.
-
New technology – newer technology means more efficient production, which means lower costs. Thus an increase in supply and the curve will shift to the right. Computer prices, for example, have declined rapidly over the past 10 years – as technology has improved and thus lowered their cost of production.
-
Change in the size of the industry – If the size of industry grows, supply will increase and the curve will shift to the right. For example, the fast-food industry in recent years. The supply curve will shift to the left as the size of an industry shrinks. For example, manual typewriters in the 1990s.
-
Tax – Sometimes the government intervenes in an industry in order to cut consumption (e.g. high tax on high polluting cars) or raise revenue (as with petrol). An increase in tax will mean a decrease in supply and thus the supply curve will shift to the left. In effect, if tax increases, the costs for the producer have increased.
__Practice drawing a supply curve. __
Scenario 1 - Imagine subsidies are removed from farming and the impact that would have on the supply of corn.
Scenario 2 - Imagine there’s a sudden increase in the number of farmers in the country.