Calculating and Estimating Gradients of Graphs
Calculating gradients of graphs
We have already looked at calculating gradients of linear graphs in Interpreting Gradients. We can use the formula: 
Now we are going to look at how we can find the gradient of quadratic graphs. We will then look at how we can interpret the results of distance-time graphs, velocity-time graphs and graphs in different financial contexts.
Gradients on curves
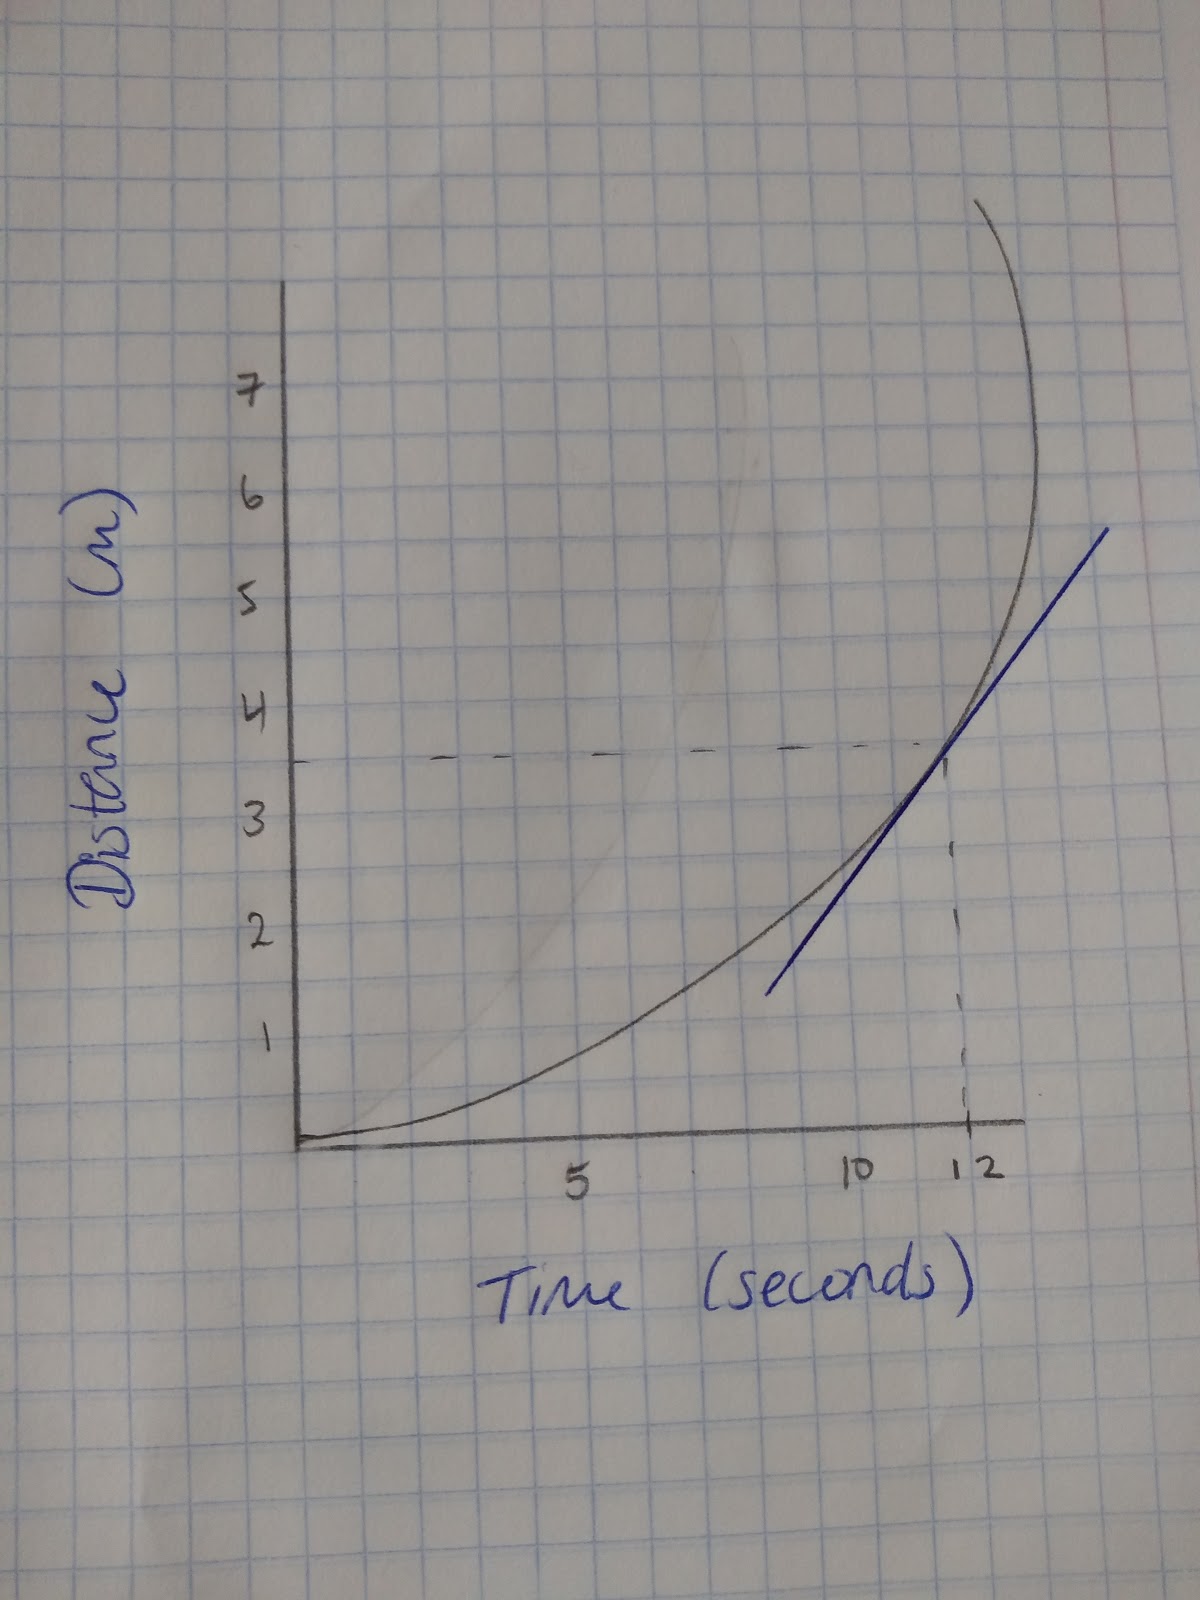
If we have a quadratic graph or any graph that involves a curve, the gradient will always be changing. Therefore in order to calculate the gradient at any given point we need to draw a tangent to the curve and calculate the gradient of that tangent. Then we will have the gradient at a specific point. For example this graph shows the speed of a sprint and I want to calculate the exact speed at 12 seconds.
Step 1: Draw a tangent at the point you want to find the gradient:
Step 2: Identify the rise and the run to calculate an estimate of the gradient.
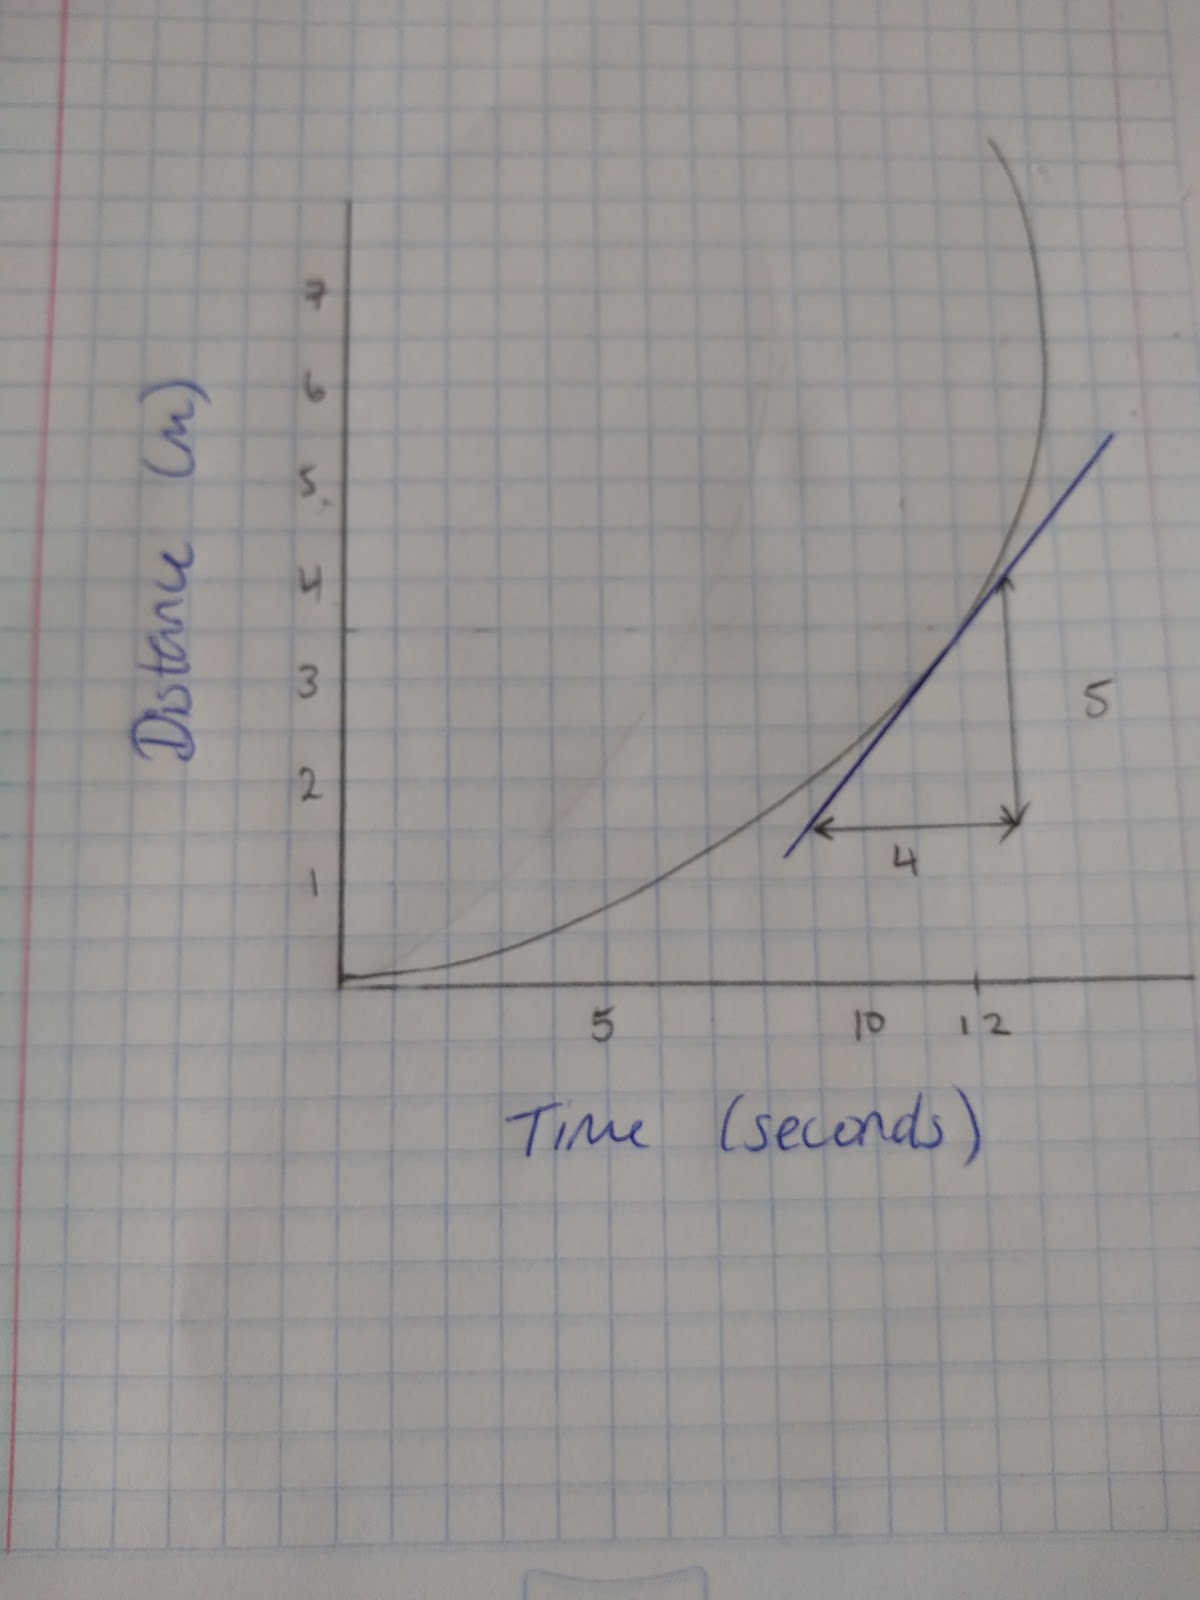
In this case the Rise/Run = 5/4. Therefore the gradient = 1.25 m per second at this point.
Calculating area under graphs
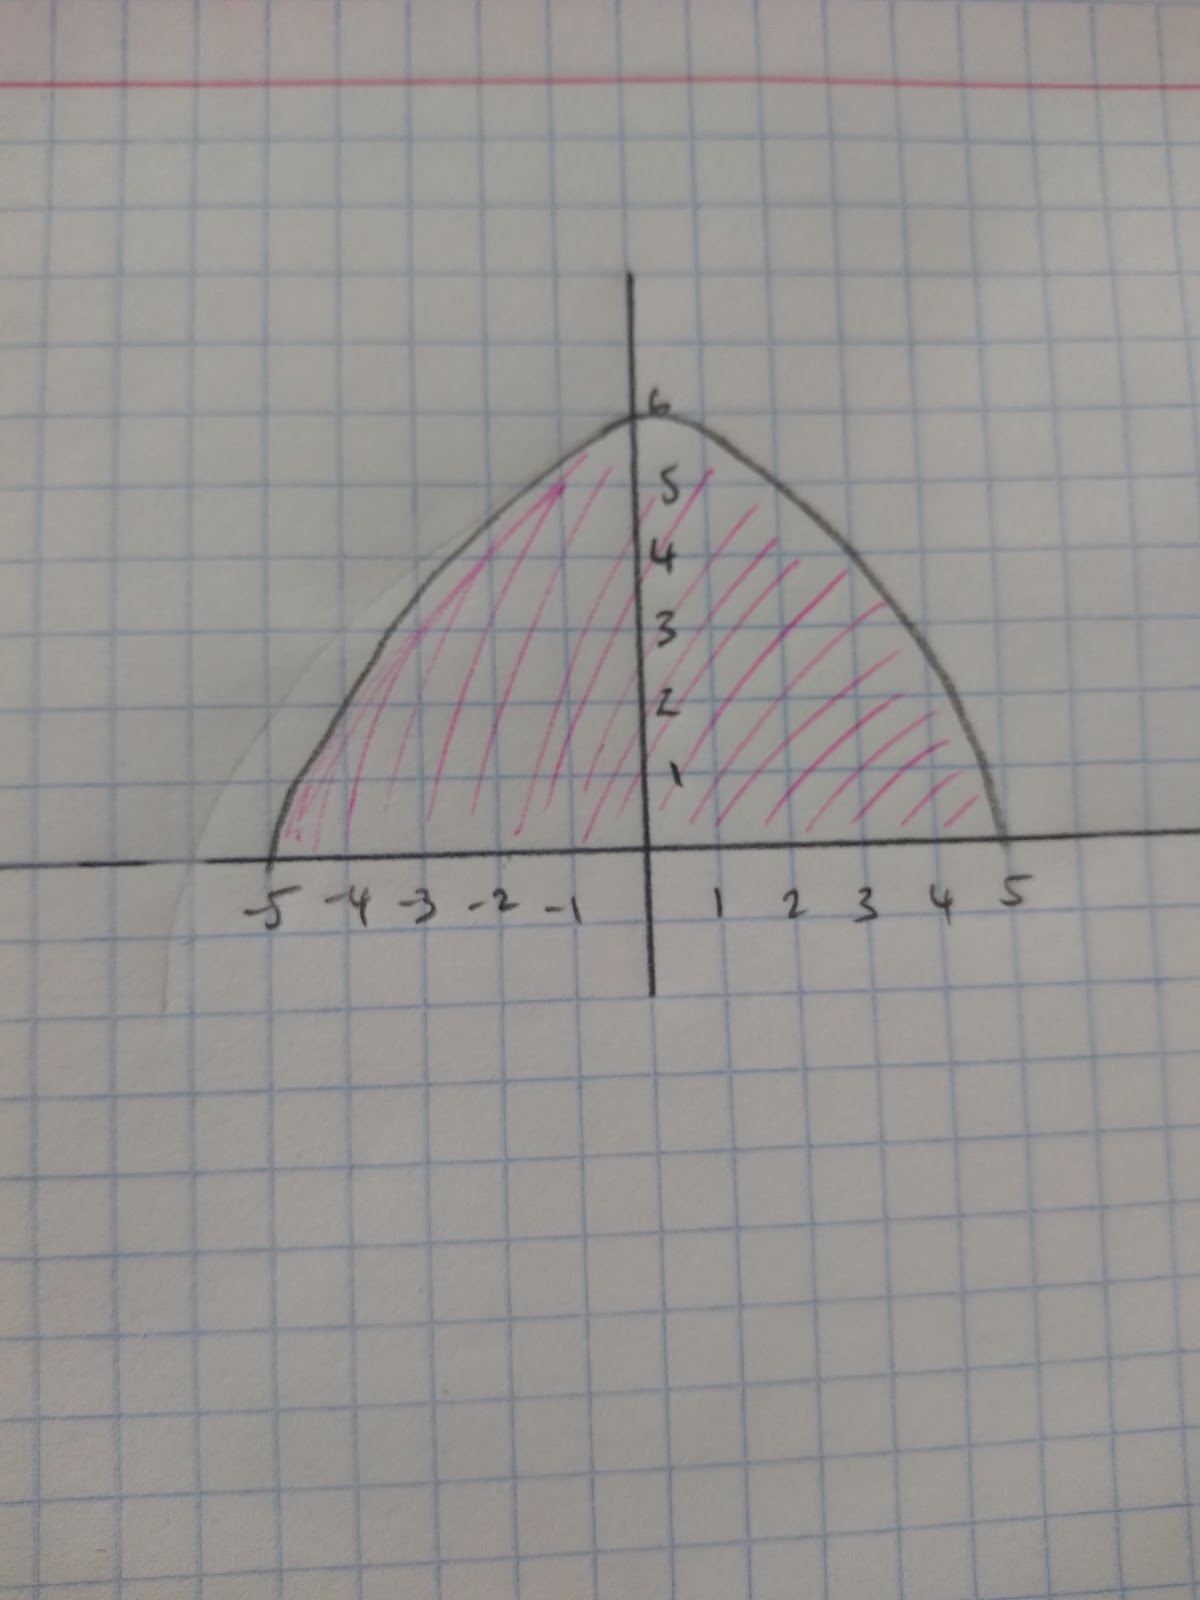
With some real life graphs, such as speed-time or velocity time graphs, it is useful to find the area underneath the graph. This is because the area underneath these graphs is the distance travelled. We can find an estimate of this area by dividing up the area underneath the graph into trapeziums, rectangles and triangles. For example:

This graph models the cross-section of a roof. Estimate the area of the cross section of the roof.
So the first thing that we need to do is to divide the curve up into different shapes.
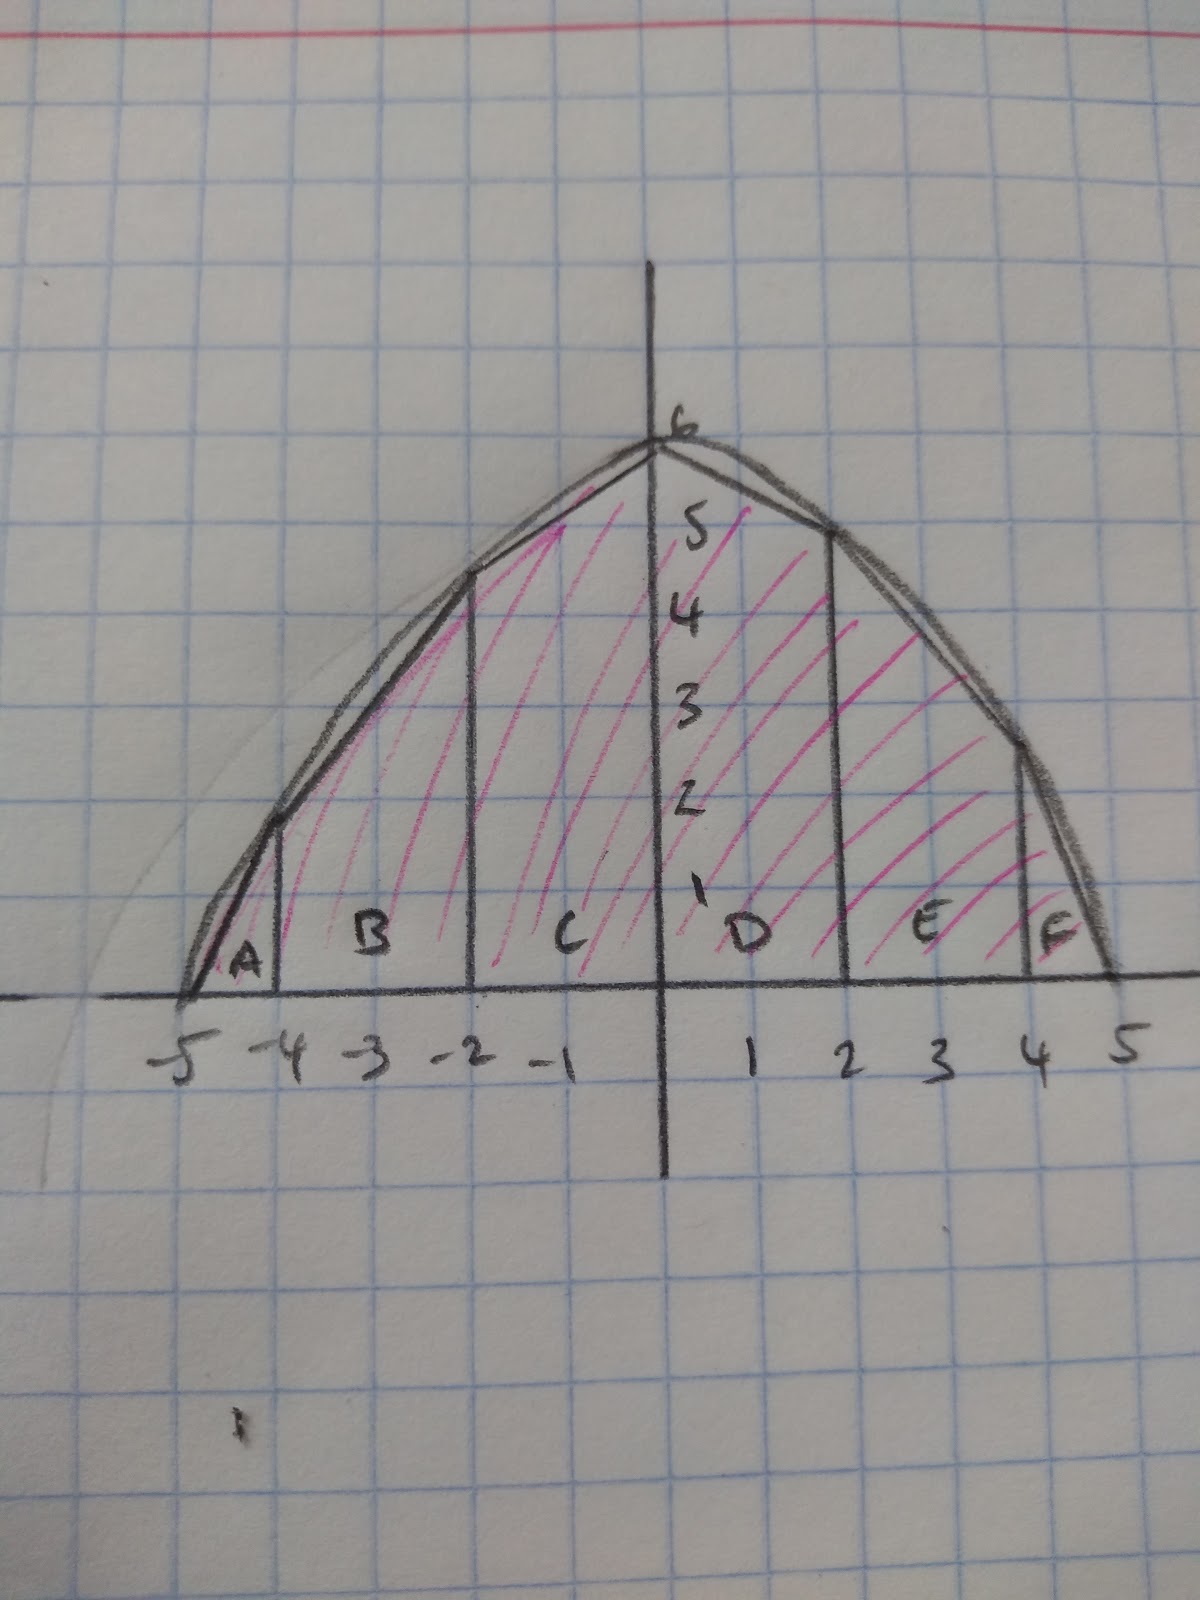
Now that we have divided the underneath of the curves into different shapes we can work out an estimated area.
Triangle A = 1 x 2 x ½ = 1
Parallelogram B = (1.8+4.3) x ½ x 2 = 6.1
Parallelogram C = (4.3+6) x ½ x 2 = 10.3
Parallelogram D = (6+5) x ½ x 2 = 11
Parallelogram E = (5+2.3) x ½ x 2 = 7.3
Triangle F = (2.3 x1) x ½ = 1.15
Add all the values and we will have our estimate: 36.85 units squared.
- What do you need to draw to find the gradient to a curve?
- Tangent
- When estimating the area under a curve which shapes could you draw?
- Your answer should include: Rectangle / Triangle / Parallelogram / Rectangles / Triangles / Parallelograms