Solving Inequalities
What is an inequality?
An inequality describes a relation between two expressions that is unequal.
For example, if we are told x>3 then we know that x will be more than three, that means it can be any number, as long as it is more than 3.
We use inequalities to describe a range of values and we can show this numerically, using a graph, a number line and also using set notation.
To be successful with inequalities we need to remember the meaning of the following symbols:
X > Y, X is greater than Y
X ≥ Y, X is greater than or equal to Y
X < Y, X is less than Y
X ≤ Y, X is less than or equal to Y
X = Y, X is equal to Y
X ≠ Y, X is not equal to Y
Using a number line
Sometimes we will be asked to show an inequality on a numberline. We use these arrows to describe the different types of relationships:
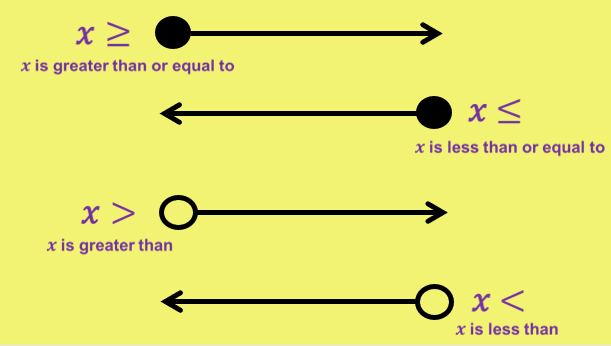
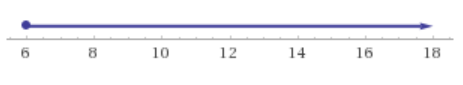
We place these arrows above a number line to display the inequality.
For example:
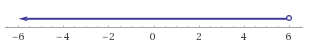
x<6
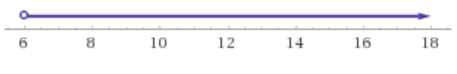
x>6
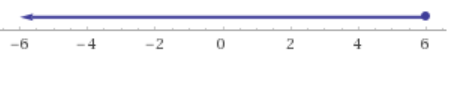
x≤6
x≥6
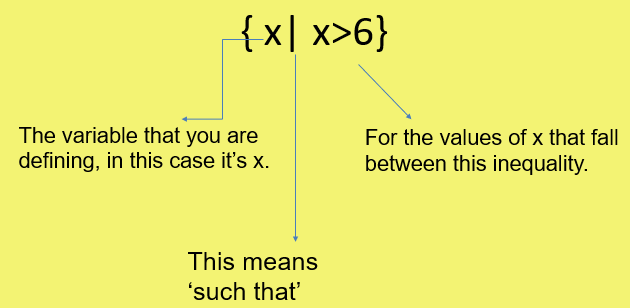
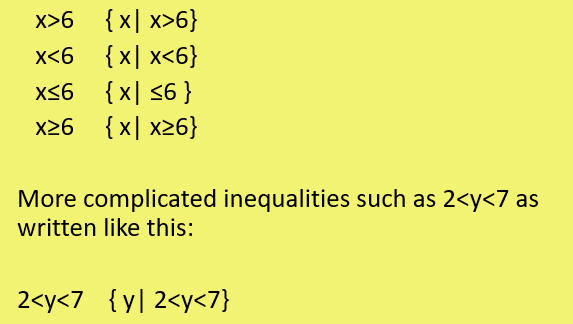
When it comes to set notation we write inequalities like this:
Other inequalities in set notation are written like this:
Writing Inequalities as Whole Numbers
Sometimes you will be asked to write down the whole numbers that could fit between inequalities.
For some tasks you may be expected to write down all the integer (the whole number), values that fulfil the region set by the inequality.
For example: Write the whole number solutions to these inequalities:
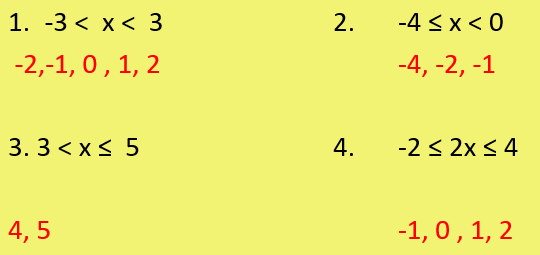
(Item 2 also includes -3! Well done for spotting my error!)
Solving line a inequalities
As with equations that show an equal relationship between terms or variables, we sometimes need to solve inequalities.
The method used to solve inequalities is nearly exactly the same as solving equations. We use inverse operations to unravel the solution, but in this case the solution will not be one specific number, it will define a region of possible numbers.
For example, let’s solve the inequality:
5x>10
Treat this exactly as we would an equation, so we will solve for x by dividing both sides by 5.
x>2 This is our answer!
Check the format that you have been asked to write the inequality- remember you can put it on a numberline!
HOWEVER when we are solving inequalities, if we have an inequality with a negative coefficient we need to make it positive by applying an inverse operation to the expression.
Real life problems with inequalities
As well as solving inequalities we can graph them. Graphing inequalities is often very useful when it comes to solving real life problems.
So how do we graph an inequality?
The graph of x=1 is similar to x<1, however x< does not just show 1 specific line, it shows an entire region. Therefore to graph an inequality first of all we have to:
Step 1: Draw the graph of the inequality as if it was an equation.
Eg. if I had x<1 or x>1 I would draw the line x=1
Step 2: Choose a value that is above or below your line.
If it fits your inequality shade the area, if it doesn’t shade the area below the line.
Eg. Shade the area that matches the inequality x>1
Step 1: Draw the graph x=1
Step 2: Choose a point, if it fits x>1 shade the area, if not shade the opposite area
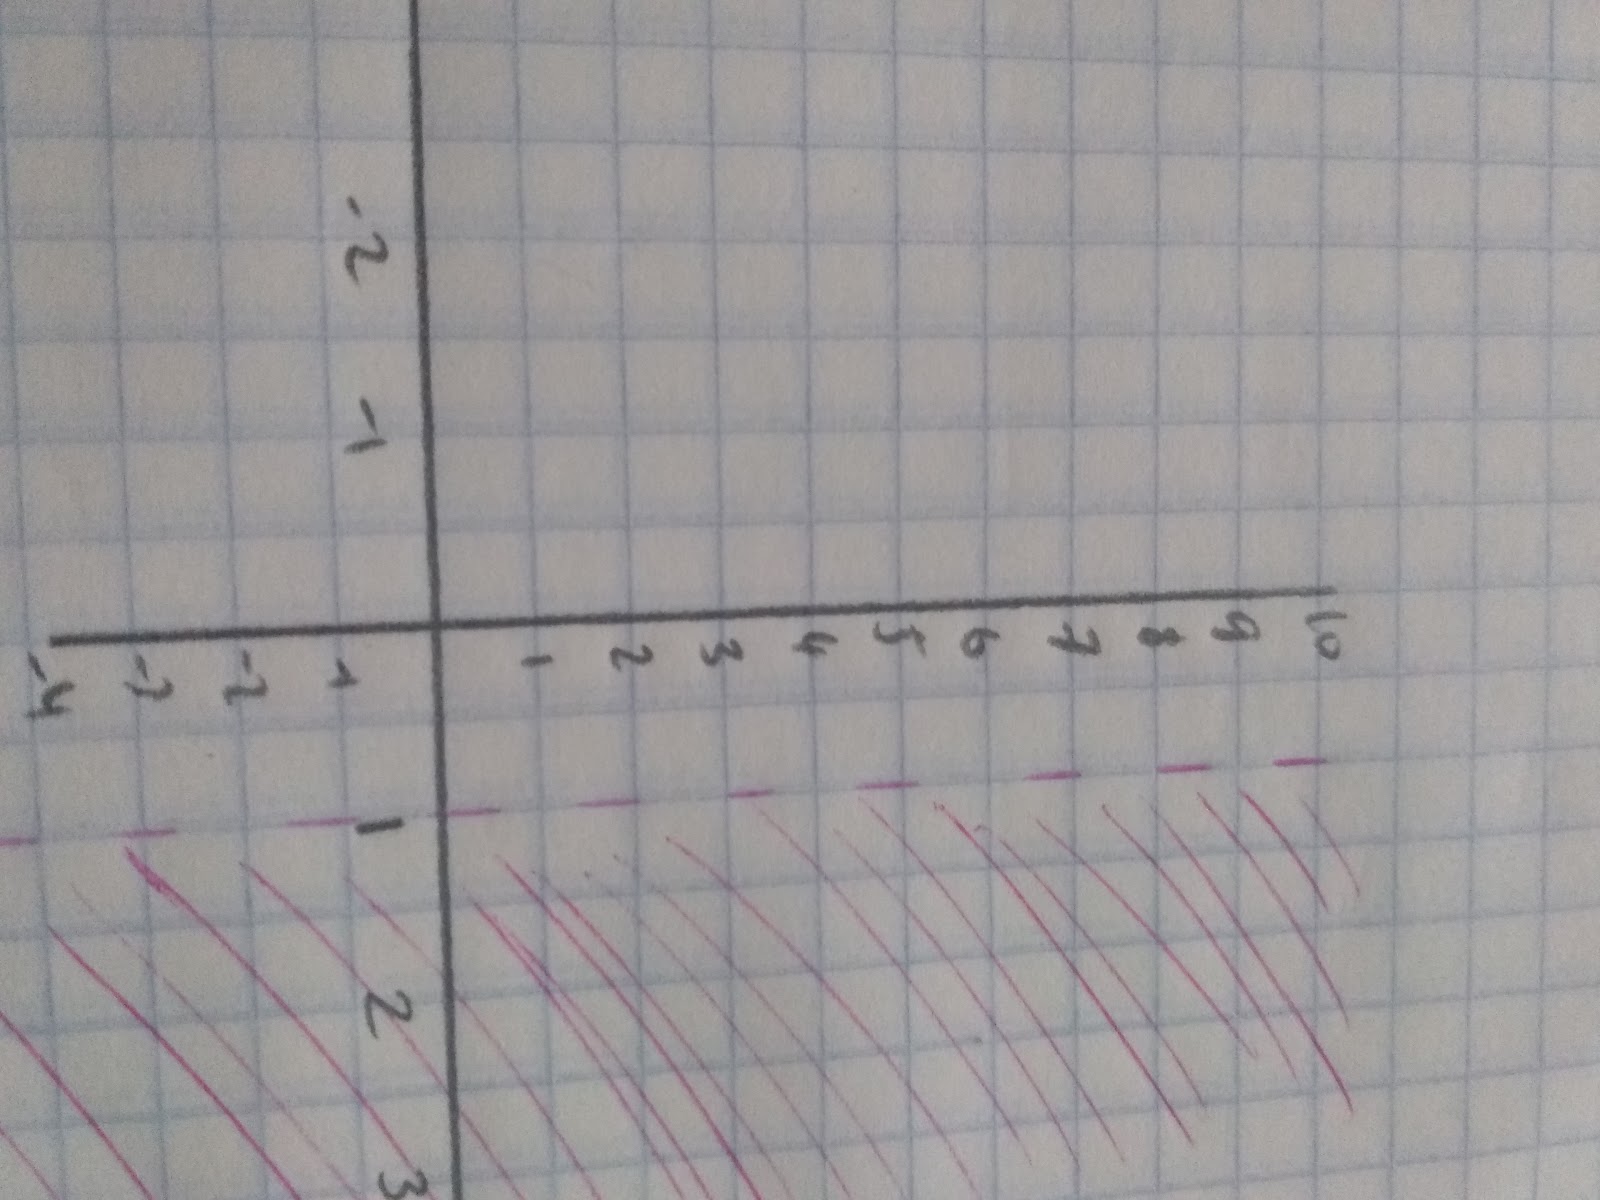
Notice that it is a dotted line that goes through x= 1. This is because the x is greater than 1. __1 is __not a value of x.
This basic principle can be applied to more complicated questions.
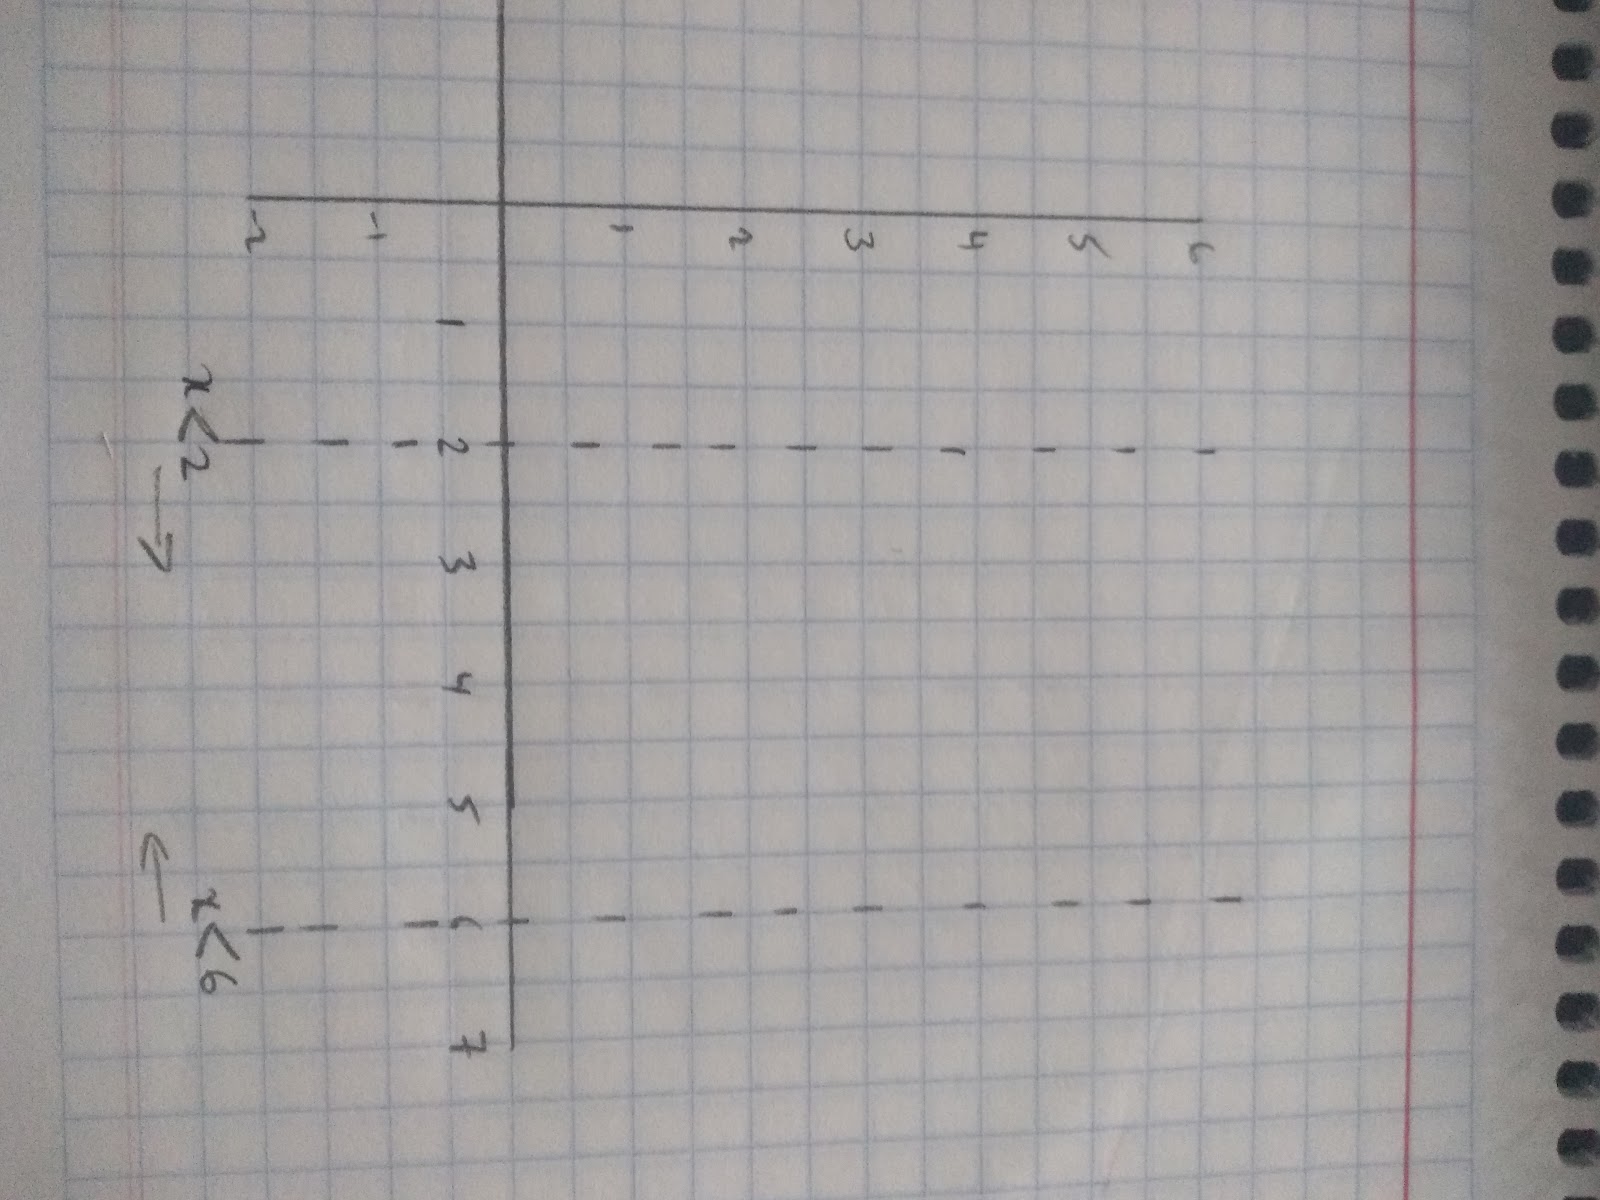
For example, the graph represents a garden. A new lawn will be put in the garden and it will be enclosed by the inequalities 2<x<6 ,1≤y≤5 and y<x+2
So here we have three complicated inequalities. The first thing to do is to break them down into different graphs.
First, we know that our value of x is between the line x=2 and x=6, draw these lines and use a dotted line to draw the graph (because x does not include 2 or 6).
For our values of y we need to draw the lines 1=y and y=5
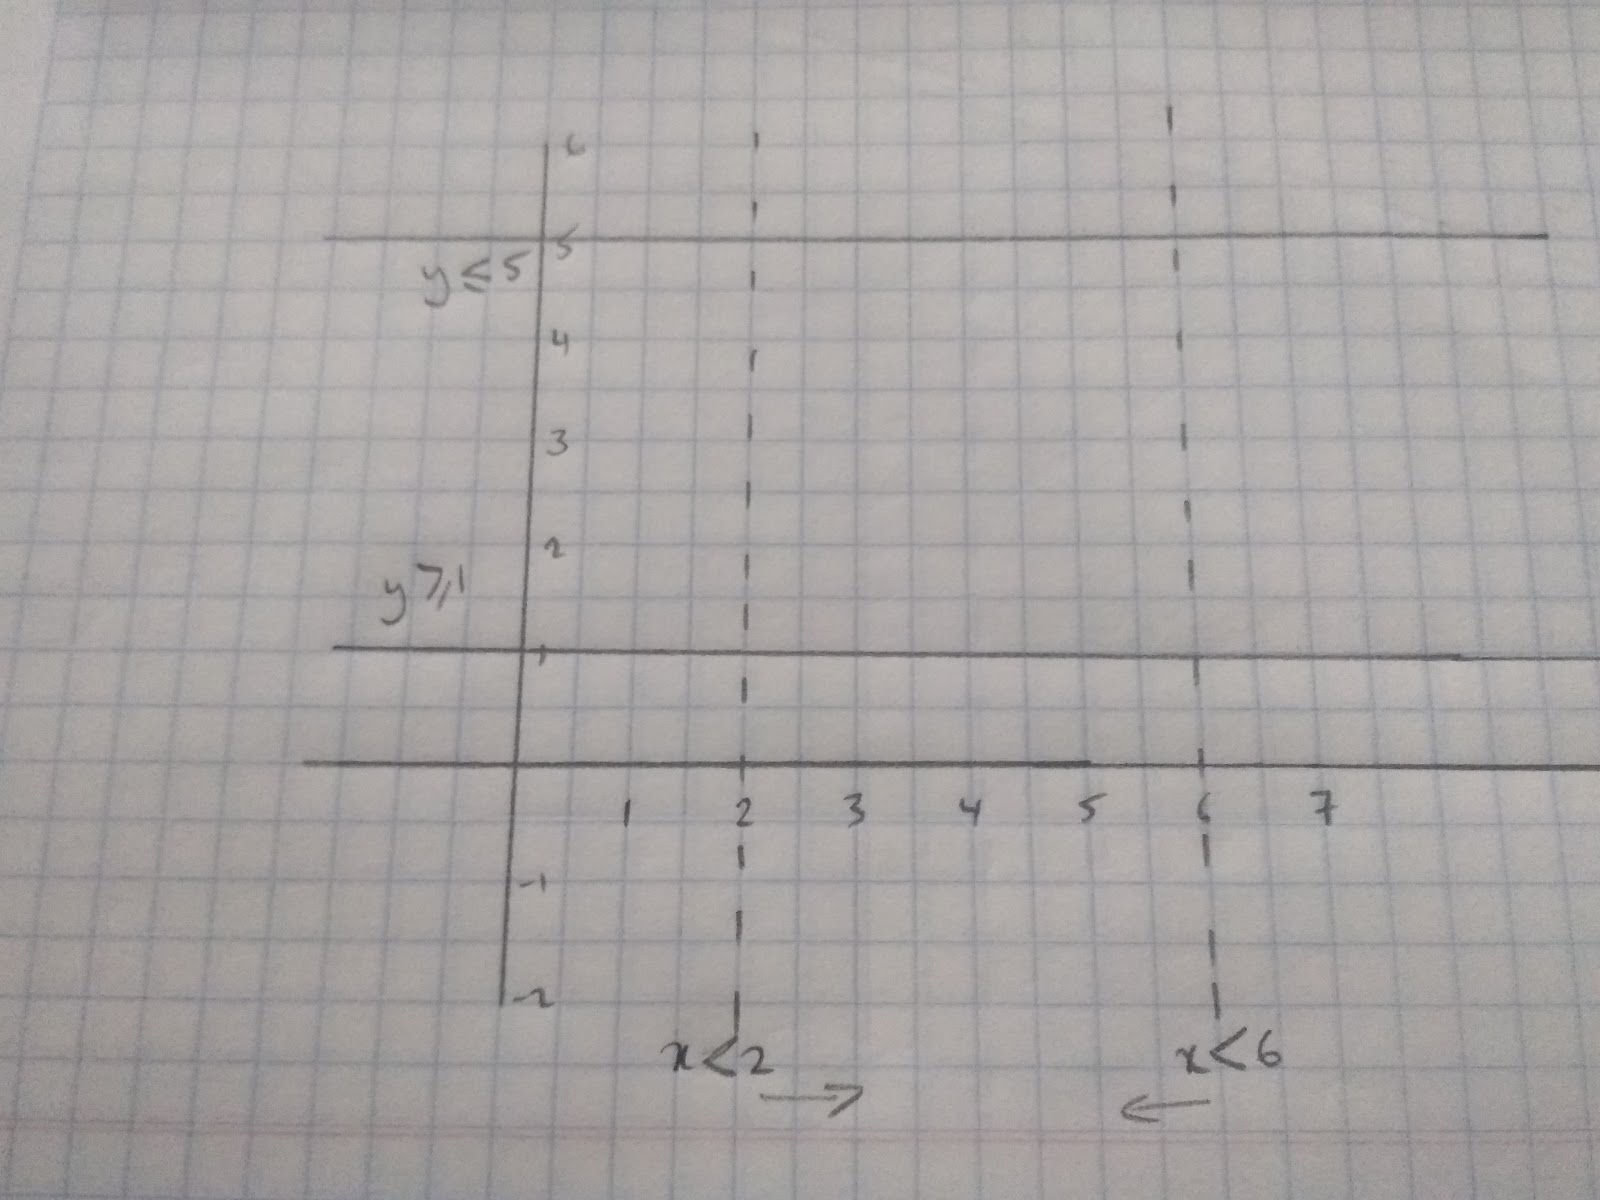
For the y values we have used whole lines to show that the line itself is included in the region of values.
Finally we need to draw the line y=x +2
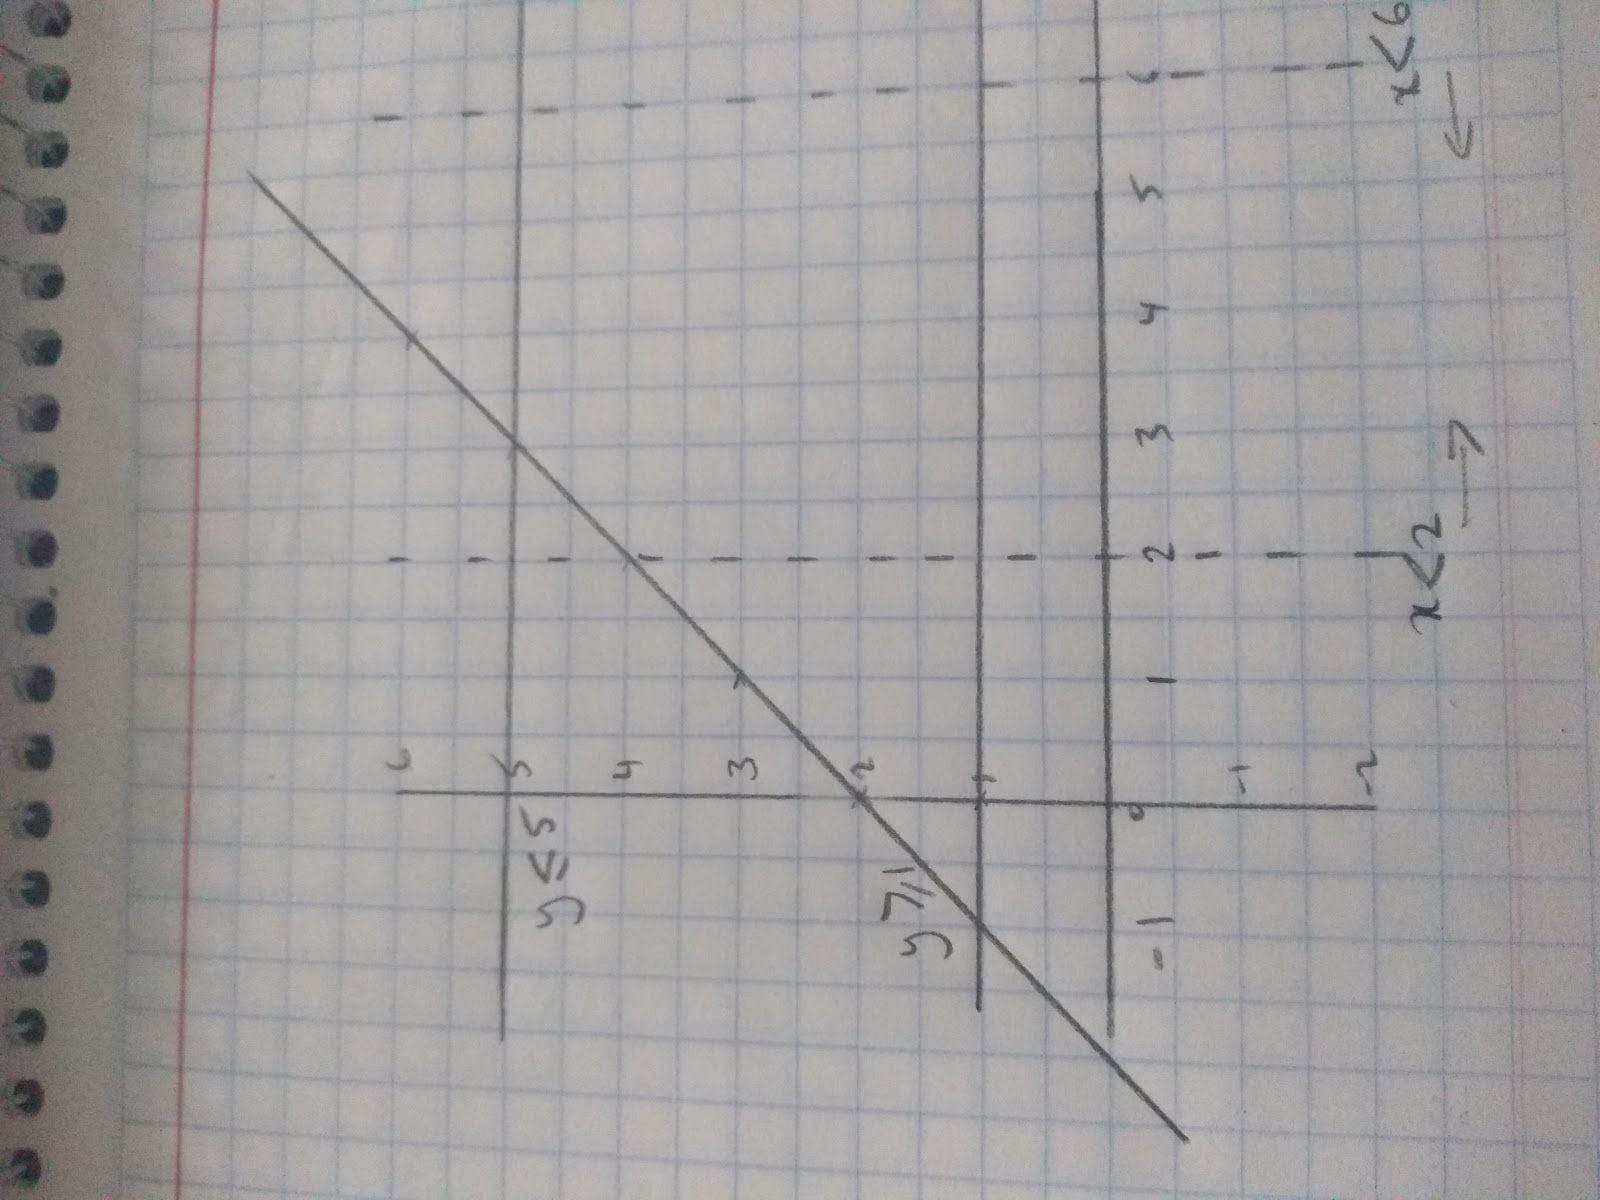
Check by choosing a point within the region that it adheres to the different inequalities.
Eg. if we choose point (4,2) we can see this is within the region because:
2<x but x<6, 1<y but y<5 and it is also less that y< x+2 as 2 <6. Therefore, we can see the part of our garden where we will put a new lawn.
- Write down the integer values between 3 < x < 10.
- Your answer should include: 4 / 5 / 6 / 7 / 8 / 9
- Solve the inequality: 5x + 2 > 22
- Your answer should include: x>4 / x > 4