Recognise, Sketch and Interpret Graphs
Sketching linear and quadratic functions
When we sketch graphs, there are some important elements that we need to show.
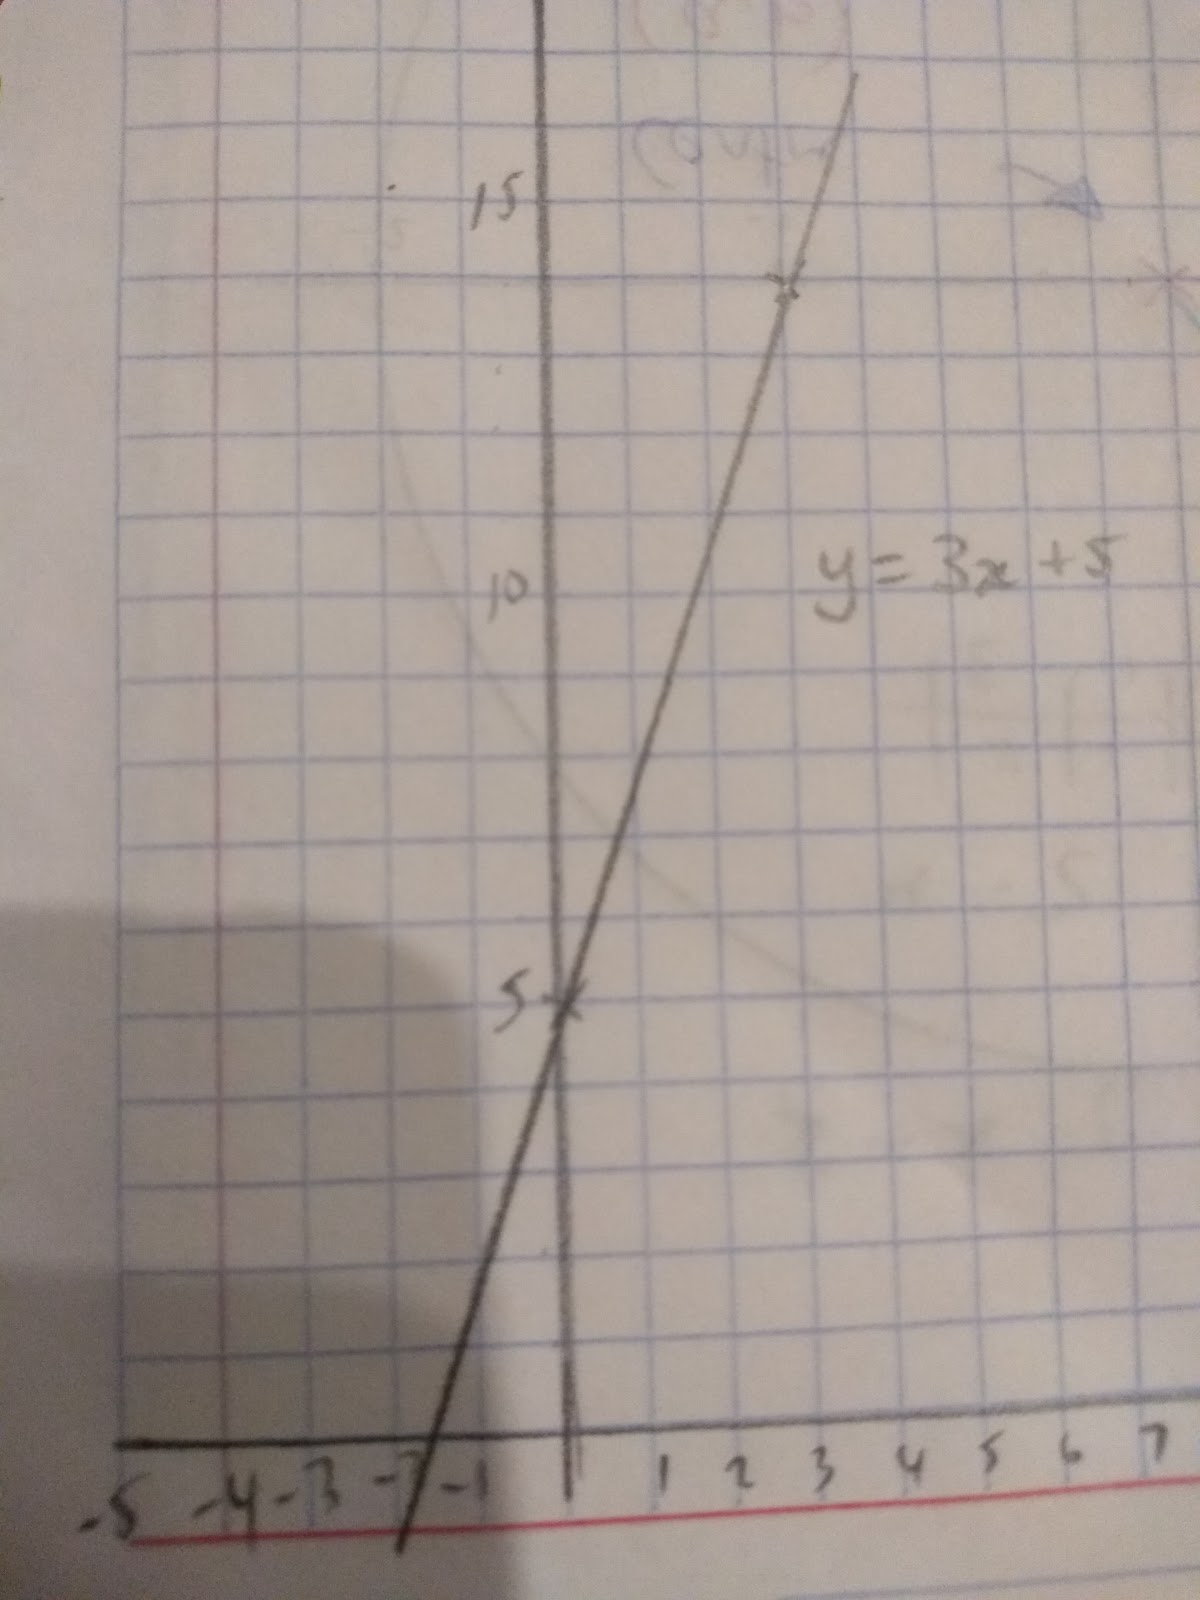
When sketching linear functions, such as y=3x+5 it is important to make sure you have shown:
- The y intercept ( where it crosses the y axis)
- That you have worked out at least two points
- Drawn a straight line through your points with a rule
Eg. Sketch the graph y=3x+5
When x=0, y=3(0)+5. y = 5
When x=3, y=3(3)+5. y=14
So we can plot the points: (0,5) (3,14)
Plot these points and connect them with a straight line.
Sketching Quadratics
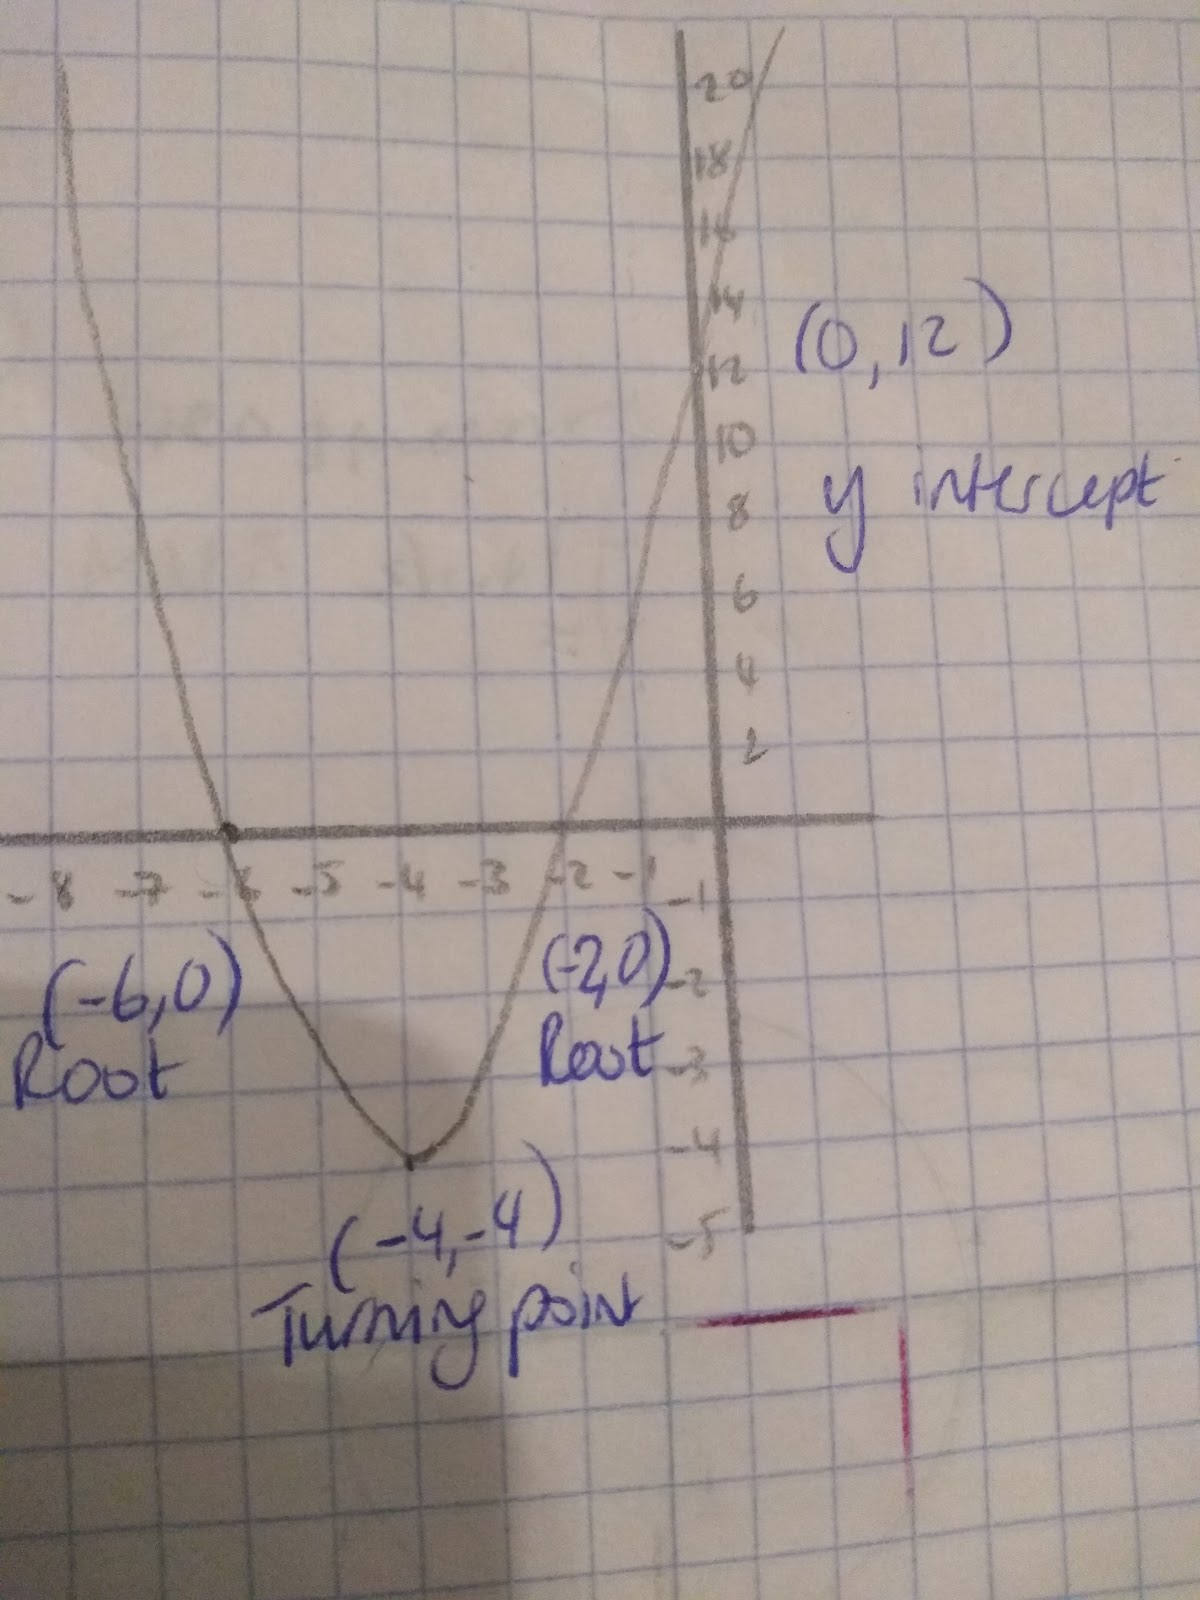
When it comes to sketching quadratics, there are a couple more things that we need to show:
- Roots (if there are any)
- Turning points
- Identify the y intercept
- A smooth curve
For example: y= x2+8x+12 or y= (x+2) (x+6)
- 0=(x+2)(x+6) therefore the roots will be x=-2 and x=-6
- Turning point’s x value is the average of the roots, therefore (-2+-6) ÷2=-4 so the y=-4. (-4,-4) is the turning point.
- y intercept is when x=0. y=(0+2)(0+6) =12. (12,0) is the y intercept.
- Sketch your graph and make sure you label EVERYTHING!
Sketching simple cubic functions
When it comes to simple cubic functions firstly let’s remind ourselves of what they look like:

y=x3__ y=-x__3
As with quadratic graphs, when we sketch cubic graphs we need to make sure we show certain things!
- Roots
- Positive or negative shape
- Smooth sketch
(Don’t worry about turning points for cubic graphs!)
Step 1: To identify roots we need the equation for our graph to be in the form: y=(x+a)(x+b)(x+c).
For when our equation is in this format, to find the roots we just need to make each bracket= 0
For example, the graph y=(x-1)(x+2)(x-3)
Therefore: x=1, x=-2, and x=3
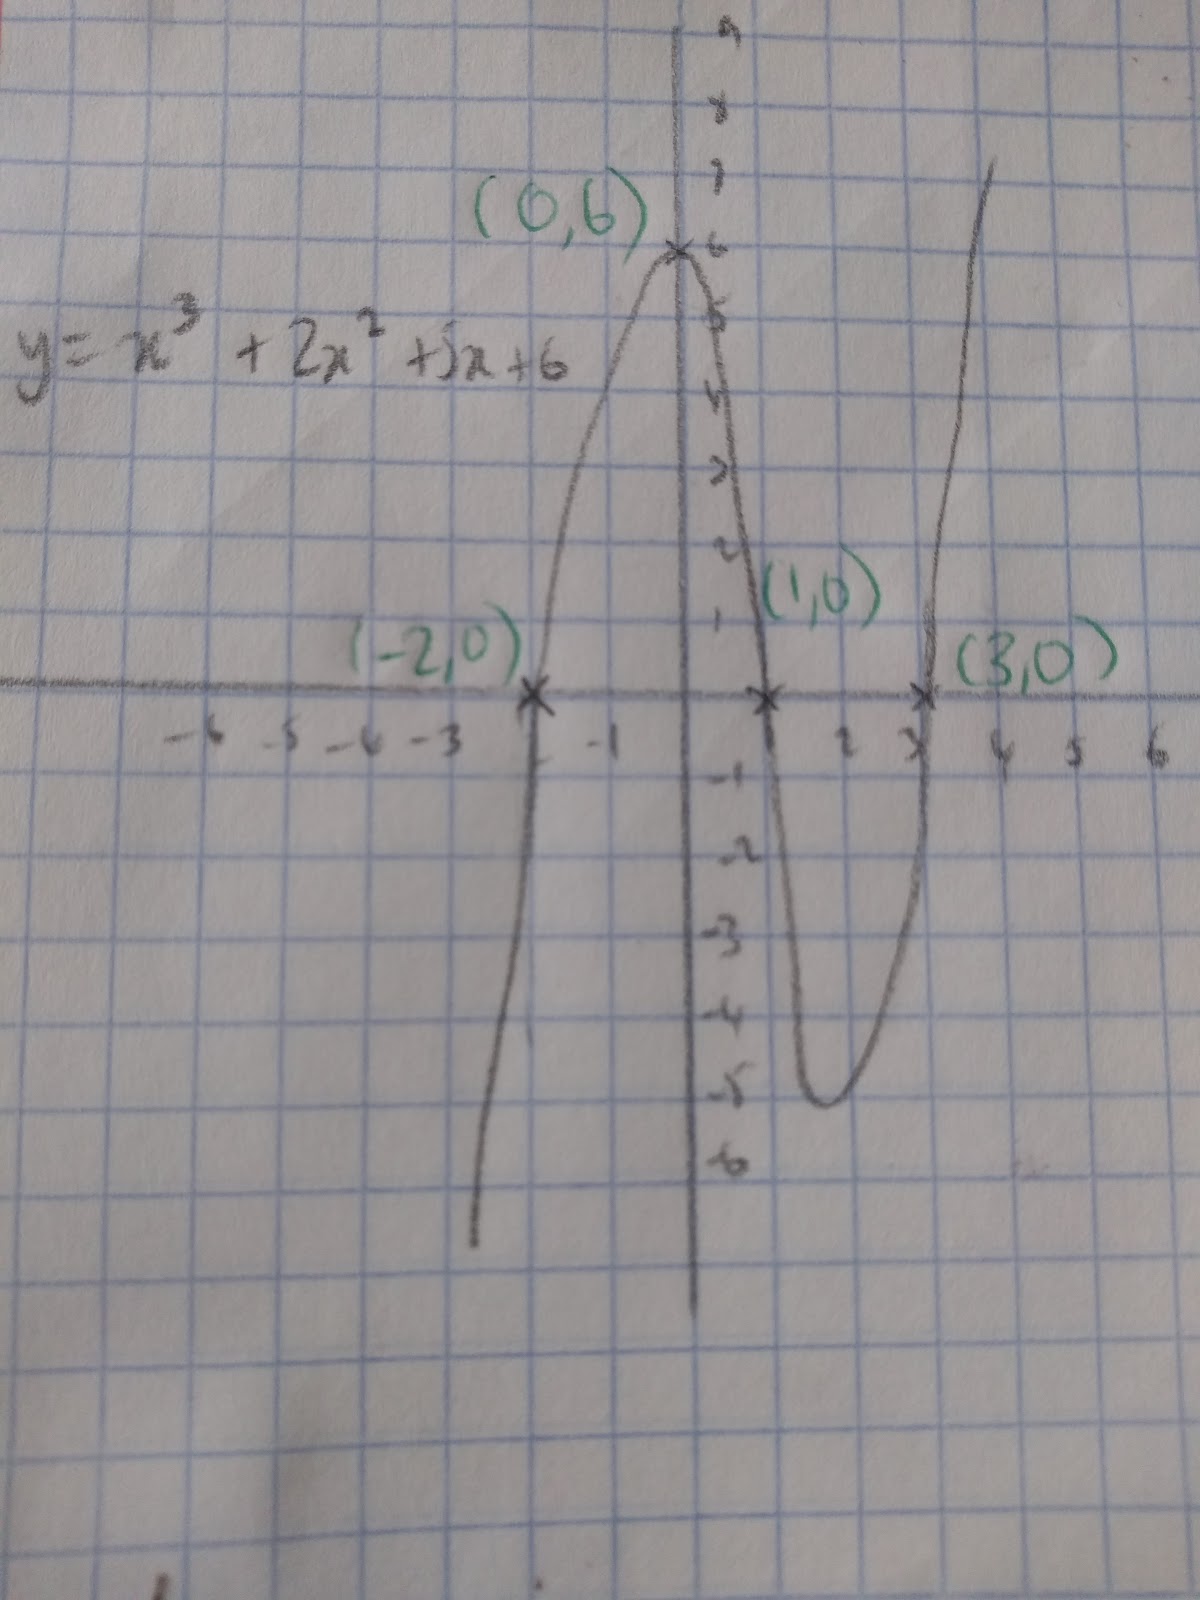
Step 2: Multiply out the brackets to see if the graph is positive or negative.
y= x3+2x2+5x+6
Sketching trig functions
Sine Graph
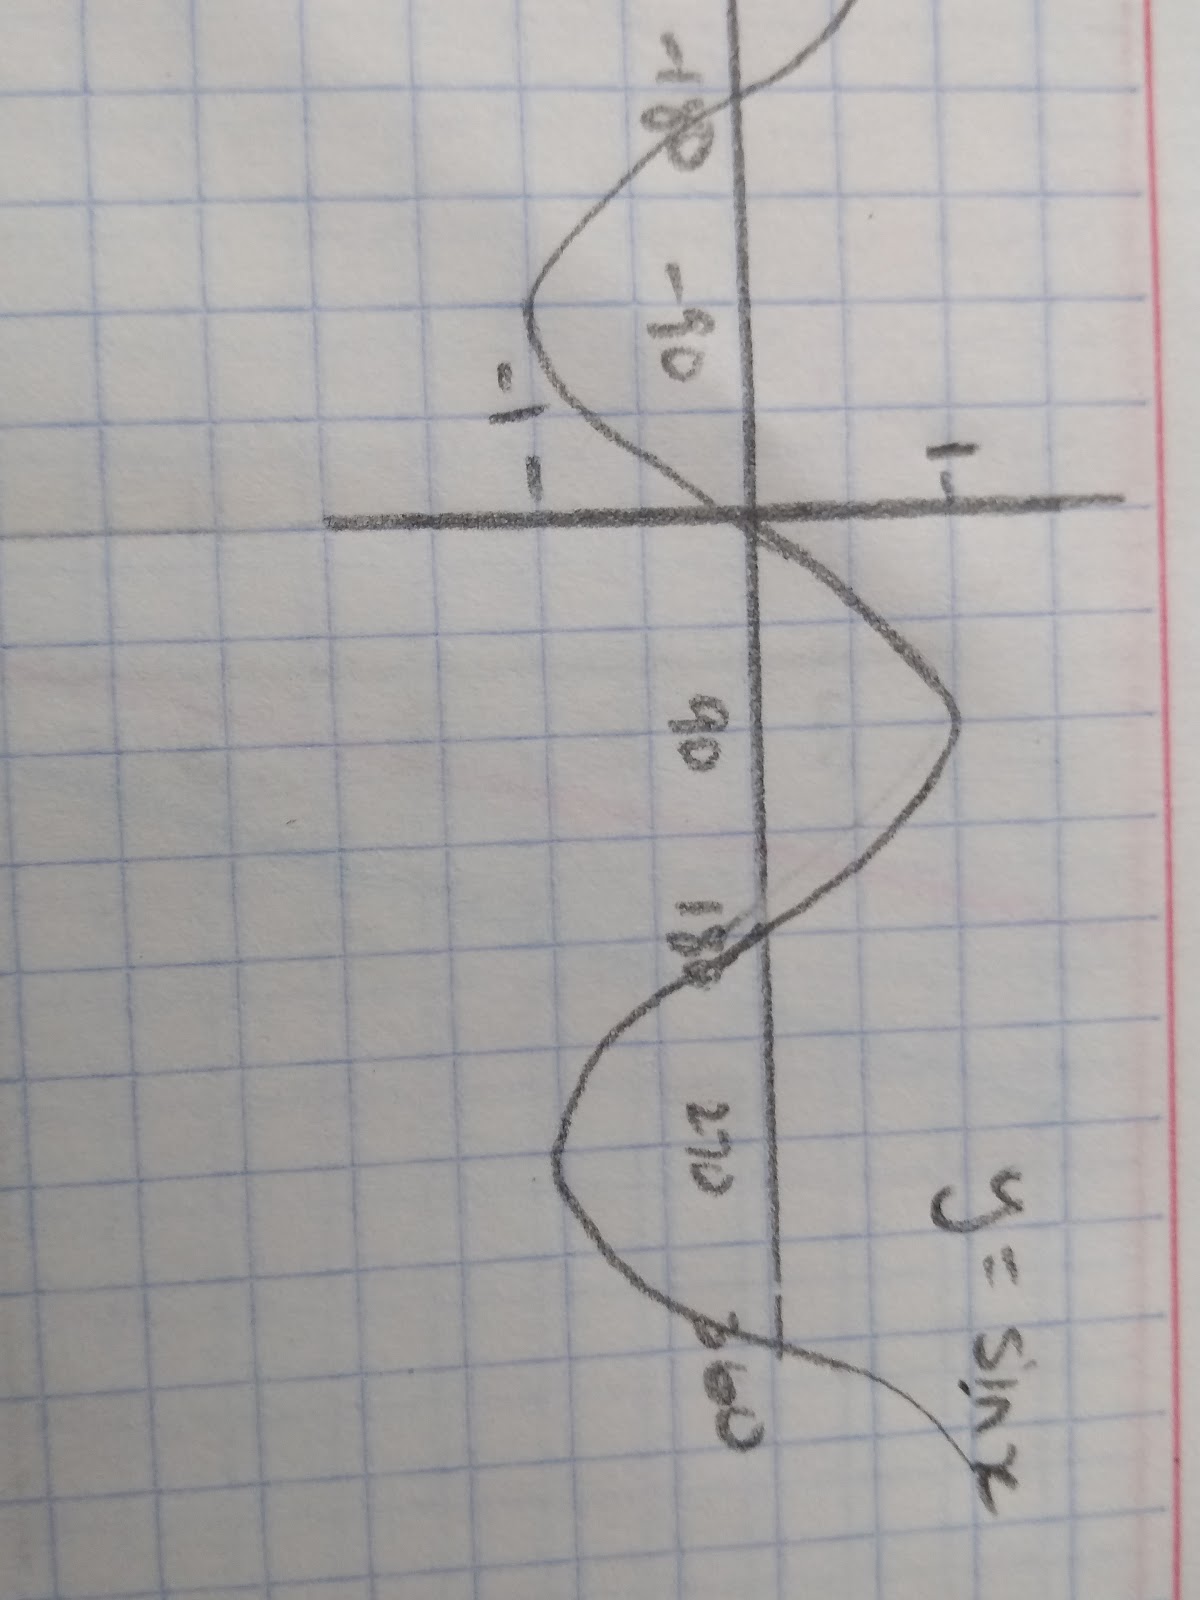
- Remember, the sine graph goes from -1 up to 1 and then decreases back to -1.
Cosine graph

- The cosine graph goes from 1 downwards to -1
Tan Graph
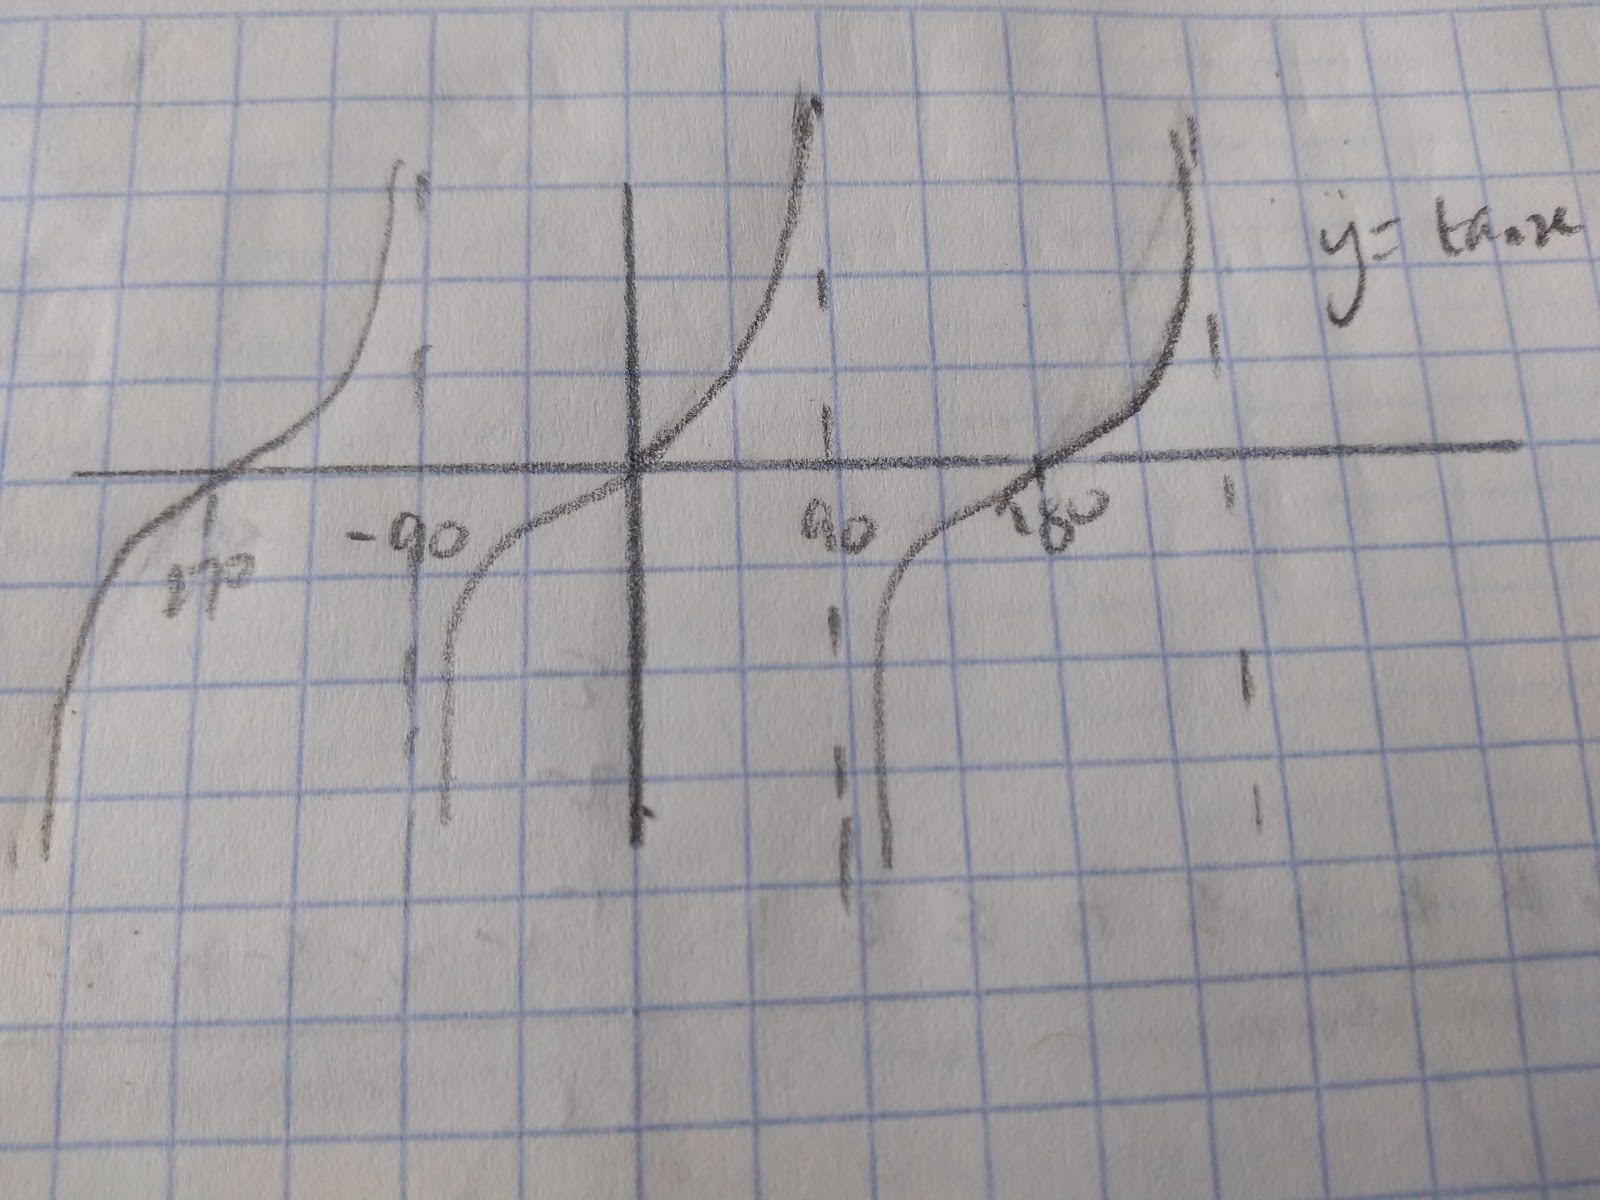
- The graph of tan x is not a wave!
- You need to know the fundamental elements of each graph, where they cross the y axis, the x axis and the shape.
- Remember sketches estimate. When you read values from a graph that you have sketched the answers will not be exact.
- You may also be required to read values from trigonometric graphs. Remember always use a ruler to help you read values from a graph! Depending on the axes these values may be in terms of pi or radians.
- What are the roots of (x+3)(x-4)(x-2)?
- Your answer should include: -3 / 4 / 2
- What do you need to show on a sketch of a quadratic graph?
- Your answer should include: Roots / Turning Points / Smooth Curve / y Intercept