Calculating Probabilities
Calculating probabilities of events
When it comes to calculating probabilities there is a simple formula:
The probability of an event happening = The number of ways it can happen / The total number of possible outcomes
For example:
I have three counters, red, yellow and blue. There is an equal probability that I can pick each one.
So the probability of picking a red counter = 1 ( Because there is only 1 red counter) / 3 ( Because there are three things that I could pick)
Probabilities of mutually exclusive events adding to 1
If events are mutually exclusive, the probability of each outcome will add to 1. (Remember, mutually exclusive means the outcome of different events cannot happen at the same time (I can’t throw a coin and land on a head and on a tail!))
For example,
I have five spinners, three red, one blue and one green.
The probability of my spinner landing on a red = 3/5
The probability of my spinner landing on a blue= 1/5
The probability of my spinner landing on a green= 1/5
If I add these probabilities I will get 1. If you remember that 1=certain, well then, if I spin my spinner I am certain to get an outcome! Therefore it makes sense that if I add all the probabilities it will equal 1.
This is often shown in a table like this:
I have a biased dice ( it’s not fair!) that has four numbers, the probability of rolling each number is below
| Number | 1 | 2 | 3 | 4 |
| Probability | 0.5 | 0.2 | 0.2 | 0.1 |
As you can see, if you add up all the decimals: 0.5+0.2+0.2+0.1=1
The probabilities will be equal to one as I will definitely get an answer after rolling my dice.
Sometimes questions will combine algebra and probability for example:
What is the probability of landing on the green spinner ?
| Spinner colour | Green | Red | Blue | Yellow |
| Probability | a | 2a | 3a | 4a |
Using the fact that the probabilities will all need to add to one, we will be able to solve this question.
First make an equation:
1= a+ 2a +3a +4a
1=10a
1/10 = a
Importance of sample size
As we noted in Recording and Describing the Outcomes of Experiments, unless we take data directly from an experiment, our probabilities will be theoretical.
So theoretically, if I were to throw a coin an infinite amount of times I would find that 50% of the time it would land on a head, 50% of the time it would land on a tail.
However it’s not possible to throw a coin for infinity! BUT the closer we get to infinity the more accurate our experiment.
It’s this idea which makes the sample size of any experiment important. The larger the sample, the closer you will be to infinity and consequently the more representative your answer or probability.
Constructing sample space diagrams
When we want to calculate the probability of two events sometimes we want to create a diagram that will display all the possible outcomes. These diagrams are called sample-space diagrams.
Example 1:
I want to work out the probability of throwing a coin and rolling a 6 sided dice.
Rolling a dice, Head or Tail
| 1H | 2H | 3H | 4H | 5H | 6H |
| 1T | 2T | 3T | 4T | 5T | 6T |
As you can see there are 12 possible outcomes and we can see them all from this sample space diagram.
Example 2:
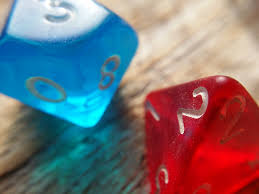
I throw two dice. A red dice and a blue dice. What is the probability of throwing at double ( two numbers that are the same) ?
By drawing out the answers in a sample space diagram I can clearly see my answer.
I can see that there are 36 potential outcomes
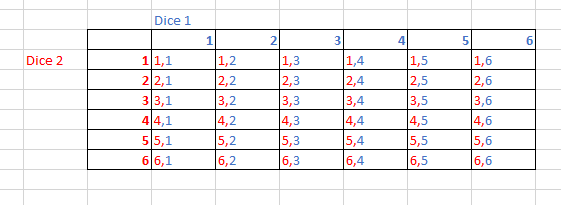
I can see that there are 6 ways of throwing doubles.
Therefore the probability of throwing a double is 6/36 = 1/6
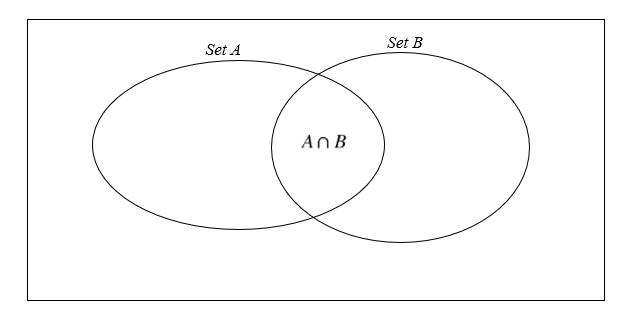
Venn diagrams and probability
Venn diagrams are extremely useful in helping us visualise mathematical relationships between sets of things. They help us put things into categories, combined events and they are also used to help us work out conditional probabilities and__ frequencies of events.__
Key Venn diagram notation:
A box. Around every Venn diagram you will see a box, often accompanied with this symbol

This symbol (and the box) refer to all the possible outcomes, including those that are not in the Venn diagrams.
The Circles- Each circle represents a set. Most sets will be labelled, often with labels such as A or B.

Key Venn diagram questions examples:
Putting information into a Venn diagram.
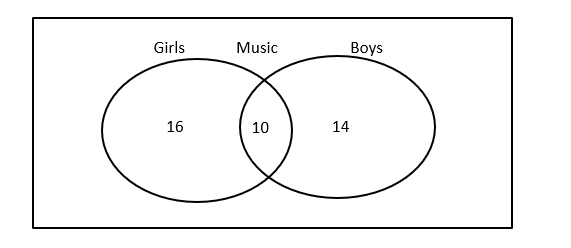
There are 40 students. 10 students learn music. 22 of the students are girls and 6 of those students take GCSE music. Draw a Venn diagram to show this:
So we know that all the students will have to self identify as a boy or a girl. Therefore we have our two main sets.
We also know that 10 of these students learn music, and 6 of these are girls.
Therefore there must be 4 boys who also learn music.
Given that 40-22 =18 the Boy set must be 18-4= 14, because 4 of these boys will be in the intersection. Therefore our Venn diagram will look like this:
As well as being able to construct a Venn diagram you may also be asked to work out probabilities from Venn diagrams. There are three main types of questions that you could be asked:
AND Questions
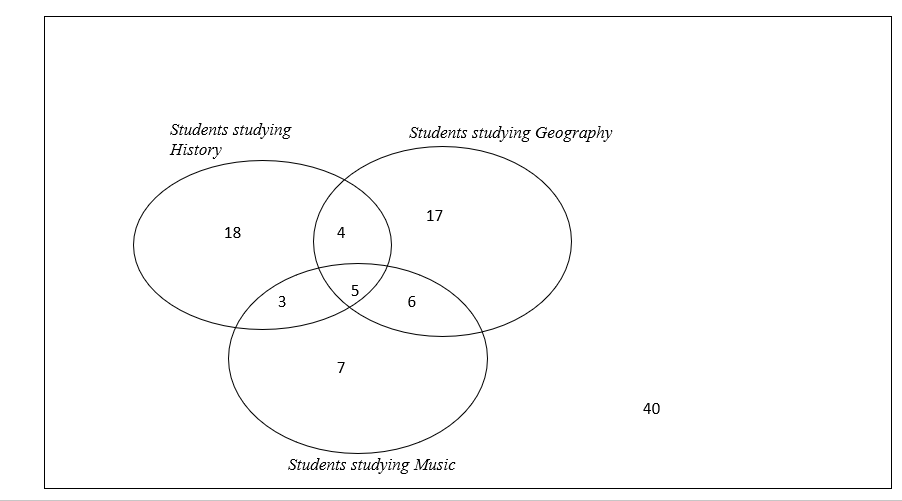
For example, if we had to pick a student ( from those in the Venn diagram above) out of a hat, what is the probability that we would pick:
A student studying Music and History?
Firstly, we need to work out how many students there are altogether. We can do this by adding all the numbers together:
18+4+17+3+5+6+7+40 = 100
Make sure you remember to include any of the numbers outside the Venn diagrams- even if they’re not in the set they still count!
Now we just need to locate the section where Music and History overlap, which is 3 +5=8.
Therefore the probability that we pick a student that studies Music and History will be 8/100.
Or Questions
We may also have to work out the probability of picking a student who has chosen to study History or Geography. This could be written such as
In this case we need to select the sets that include __all __the students who study History and __all __the students who study Music.
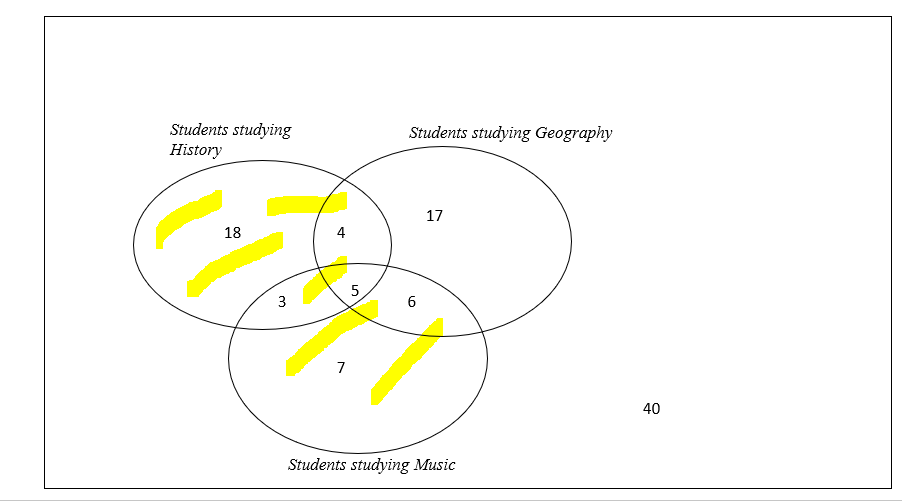
Therefore that would be:
18+4+3+5+6+7=43
43/60
Not being in something questions
When something is not included, we use the ‘, P(‘Music) = the probability that someone does not study music. This means we’re looking for the number of students who are not in the circle of M.
The P(‘Music) = 100-21/100 = 79/100.
Sometimes these will be combined with something else such as .
.
This means we want all of the students study History but not music. Therefore we can select the following:
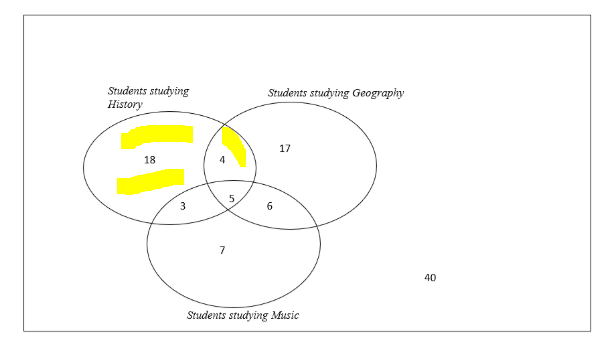
= (18+4)/100
= 22/100 = 11/50
Tree Diagrams
Tree diagrams are very useful in helping us work out the probability of more than one event happening.
For example, Robin has some sweets in a bag. There are peppermint and raspberry flavoured sweets. The probability that he chooses a peppermint sweet is 0.2 whilst the probability that he chooses a raspberry flavoured sweet is 0.8. He picks out a sweet, decides not to eat it, so puts it back in his bag and chooses another.
We can show this using a tree diagram:
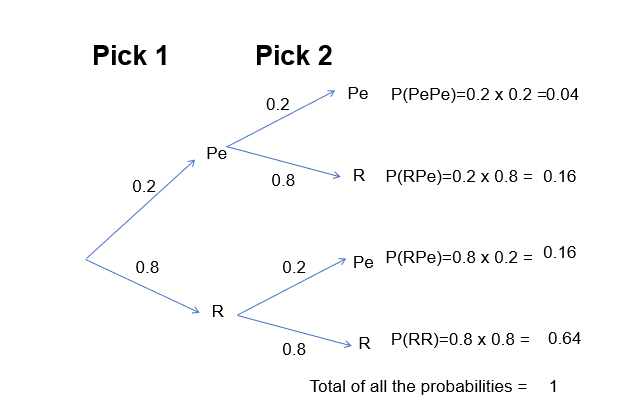
You can check that your tree diagram is correct as all the probabilities will add to one.
We work out the different probabilities by using the ‘AND’ and the ‘OR’ rules. That’s why when using a tree diagram, we multiply when we go across ( as we’re using the ‘AND’ rule) and we add when we want to combine probabilities ( as we’re using the ‘OR’ rule)
In this example the two events are independent. Because Robin put the sweet back, each time he picked a sweet the probability of getting a peppermint and getting a raspberry sweet were the same.
However, we can also use tree diagrams to show conditional events. These are events where the probability will change depending on a prior event.
For example. Gabriel also decides he wants some sweets, and also has a choice between peppermint or raspberry, just like Robin. But unlike Robin, Gabriel is going to eat the first sweet that he picks. This means the probability of Gabriel picking his second sweet will change as there will be fewer sweets to choose from.
Therefore his tree diagram will look like this:
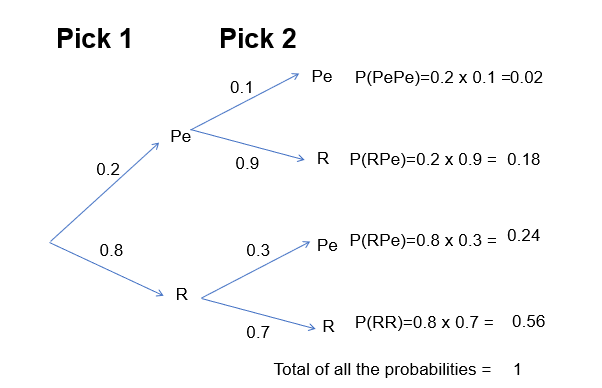
The probabilities that show all the possible combinations will always add to 1.
Notice, how the probabilities for Pick 2 are different- that’s because Gabriel’s second pick’s probability depends on the result of his first pick.
When working with conditional probabilities we can also use this formula to help us work different probabilities:
- Carol has a packet of sweets. She has 4 red, 6 purple and 2 yellow. What is the probability that she picks a purple sweet?
- Your answer should include: 50% / 50 / 1/2