Plotting Tricky Graphs
Plotting reciprocal graphs
Before we plot a graph it is important to think of the general shape of the graph.
Reciprocal graphs:
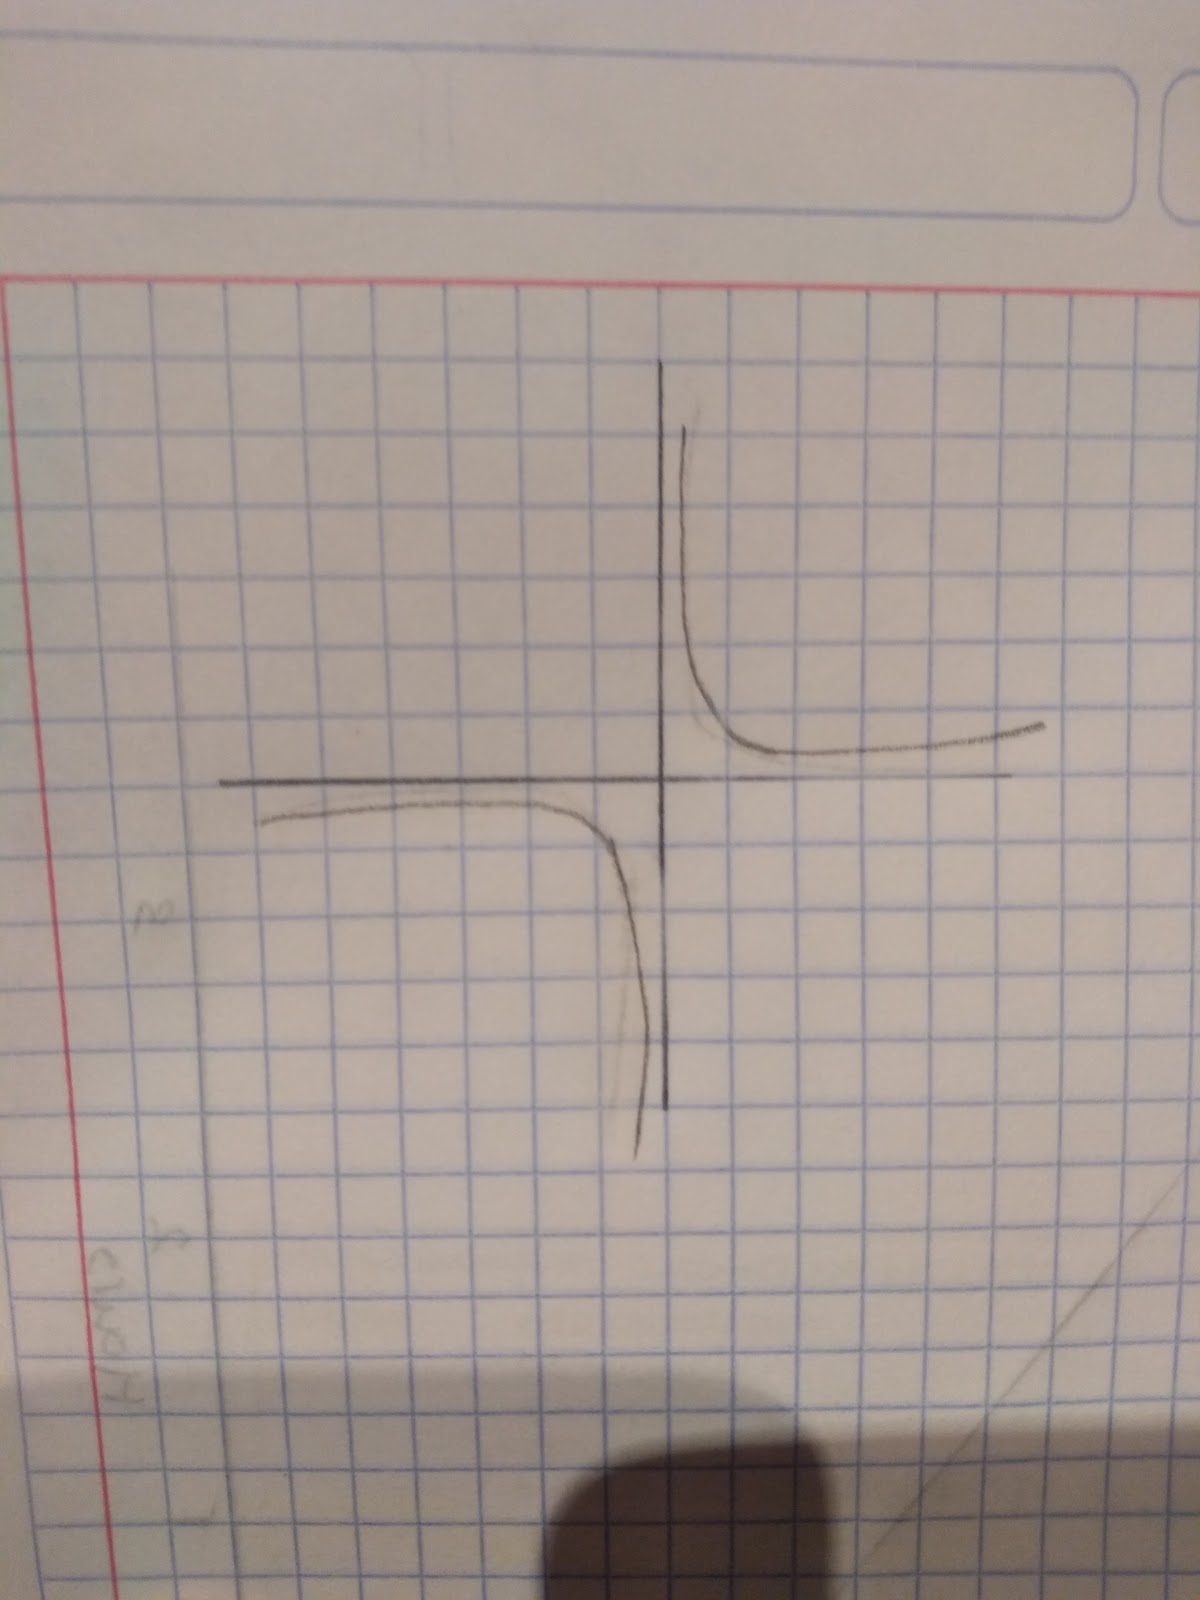
This is a rough sketch of the general reciprocal graph. For example, if you are asked to sketch the graph: y=1/x
Step 1: Start by drawing a table:

Try and use values that will give you easy numbers to plot!
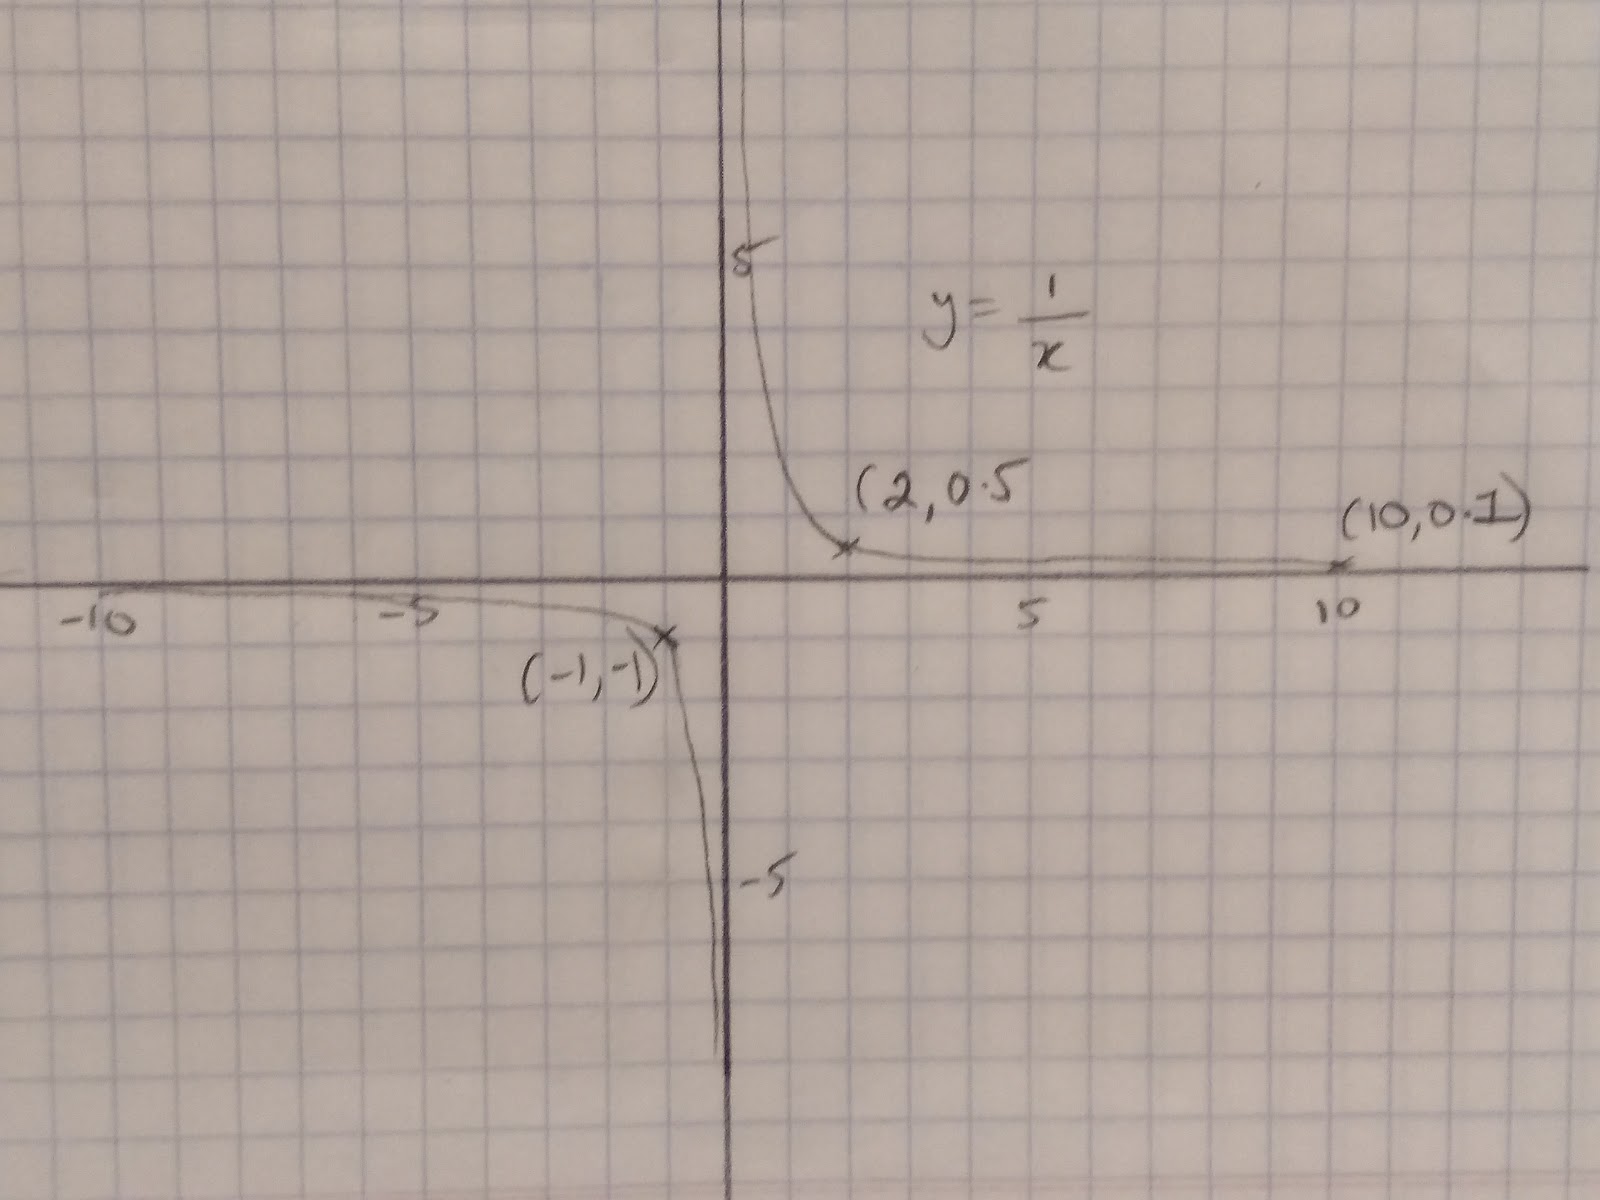
Step 2: Plot the points (-1,-1) (2,0.5) (20,4)
Step 3: Draw a smooth curve. Check that it does not go through the origin (0,0)!
Plotting exponential graphs
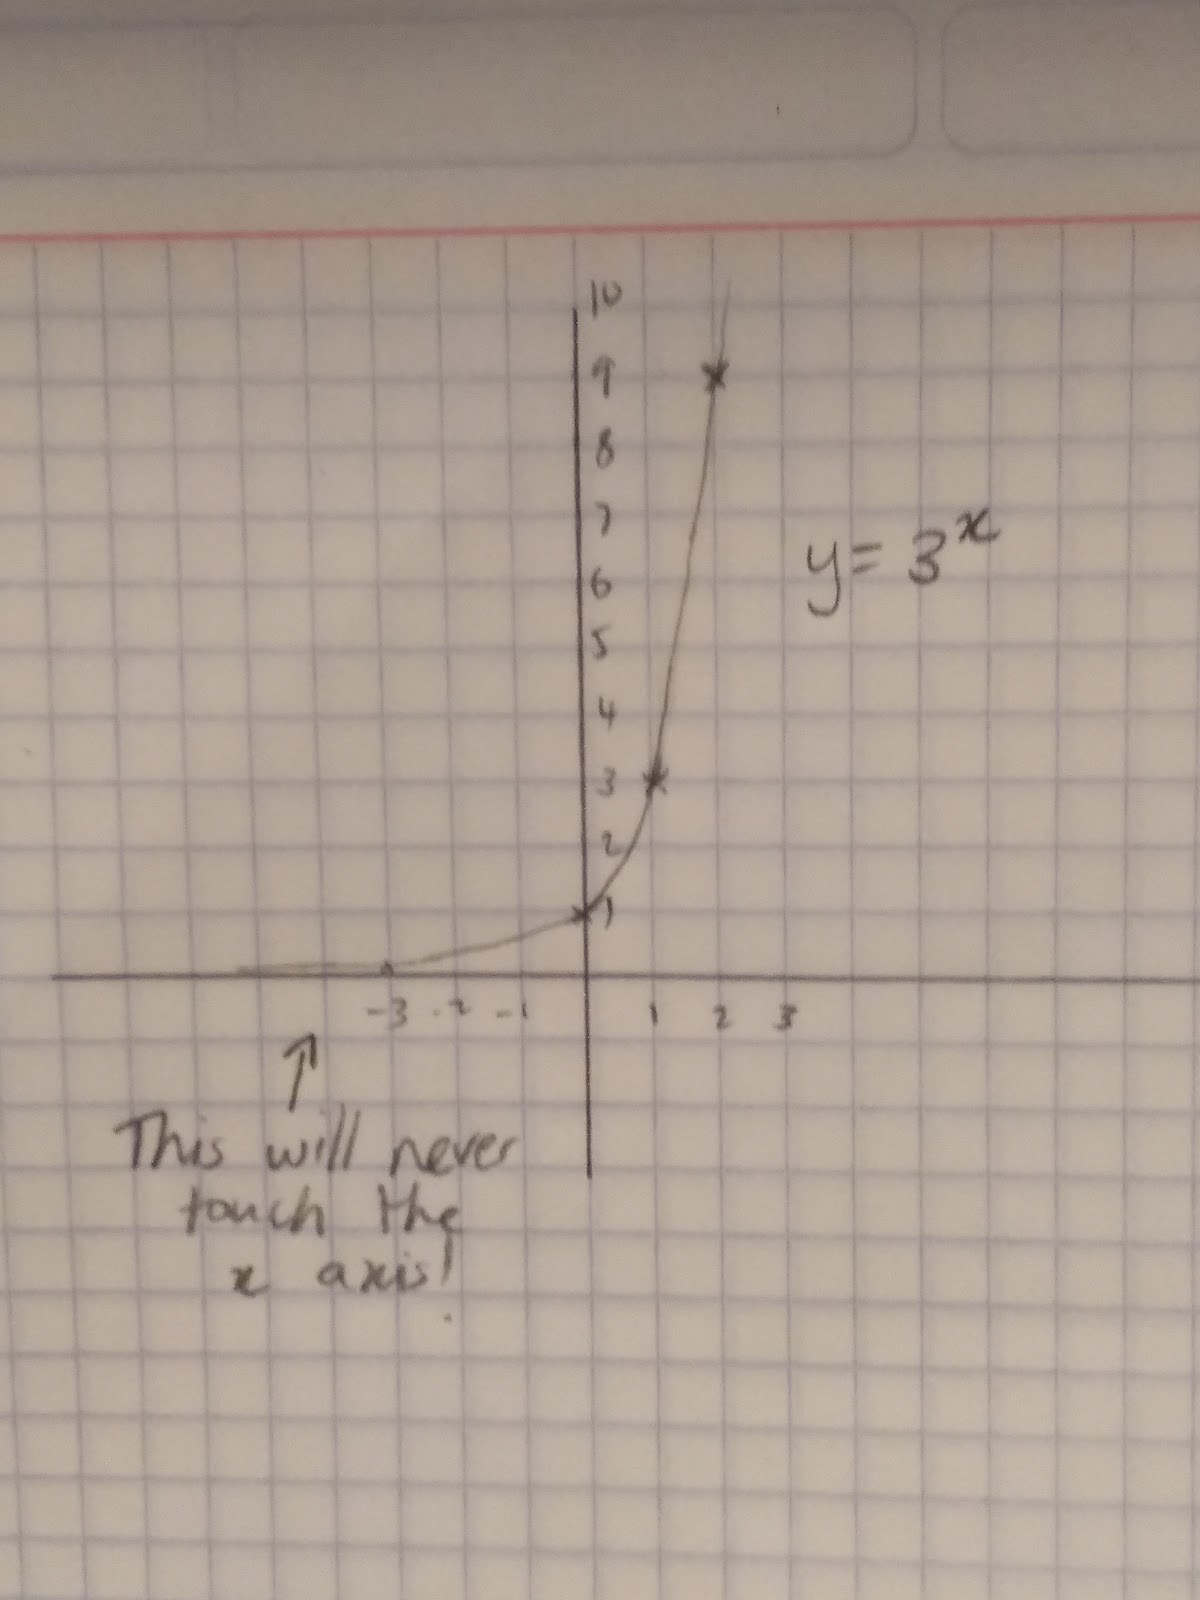
y=3x. With exponential functions, they go up exponentially!
Once again the best way to sketch them is to get some points. Once again get a table and choose some values of x. Make sure you choose positive and negative value.
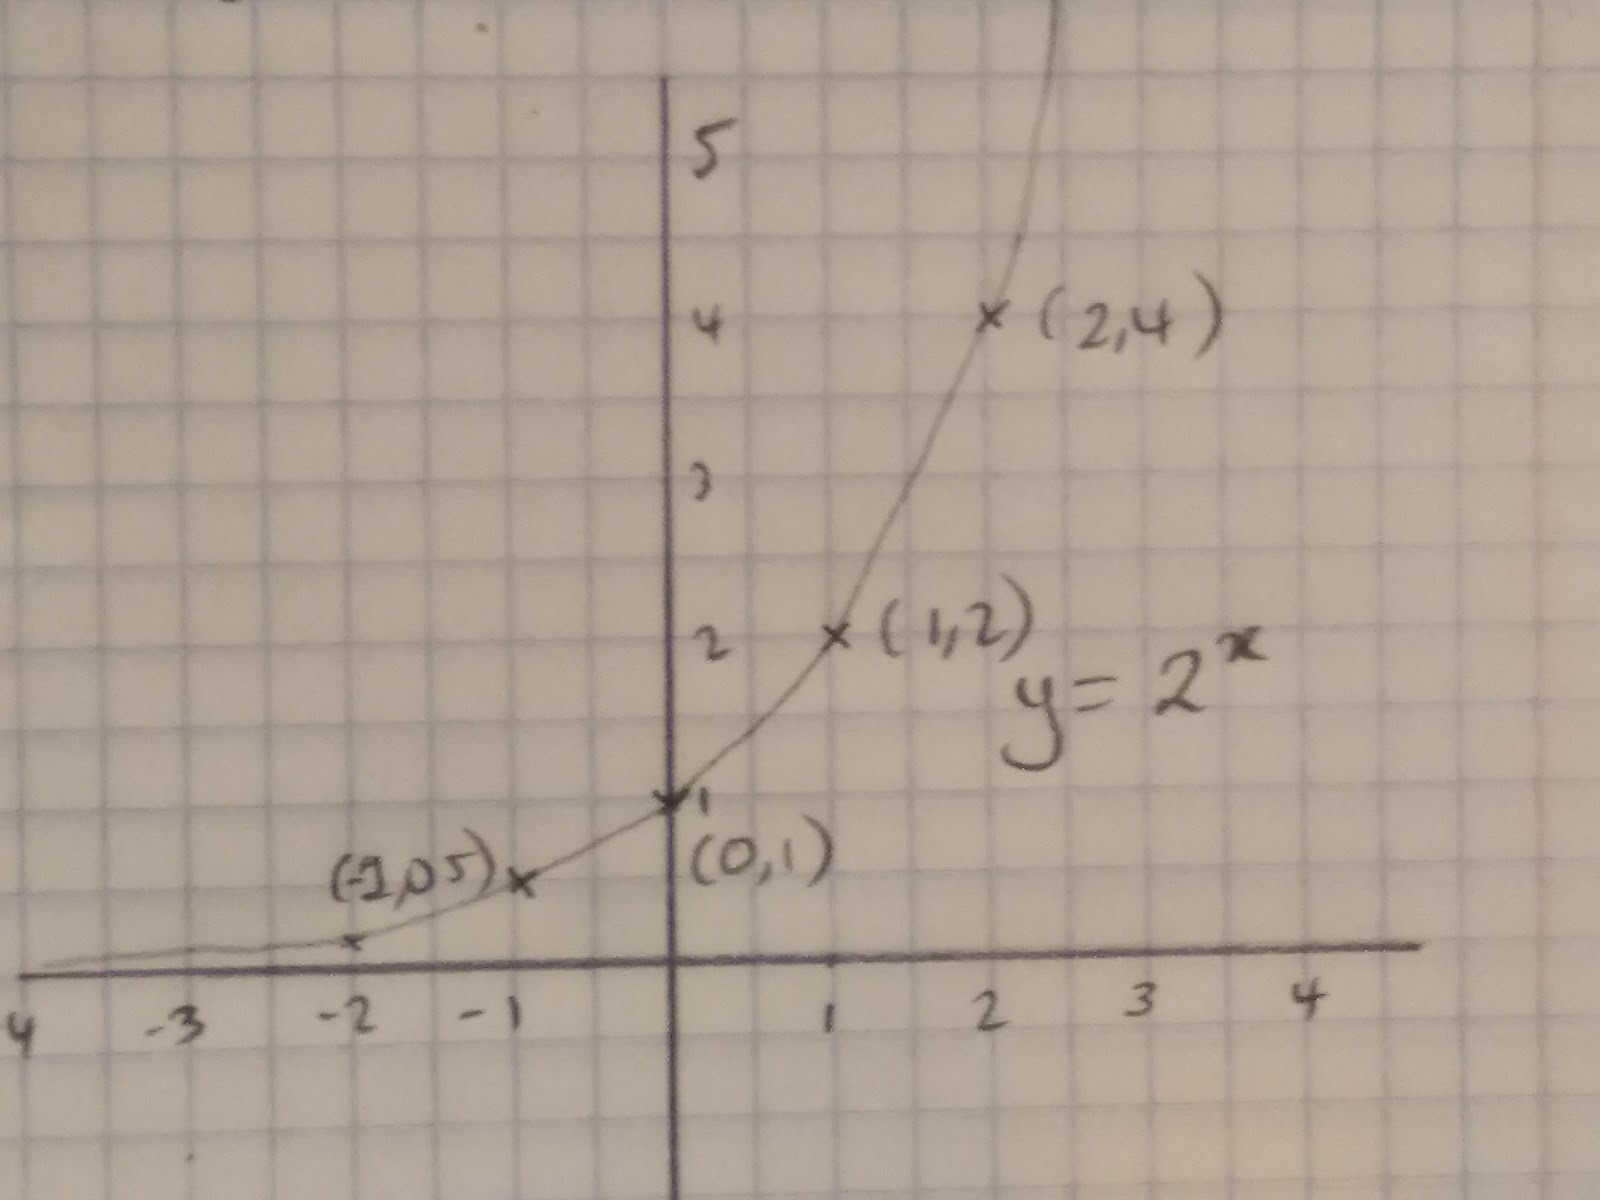
y=2x

Plot the points (-1,0.5) (0,1) (1,2) (2,4). Then join them together with a smooth curve. Remember the graph will never touch the x axis because y is never zero in this equation!
Plotting graphs in real life contexts
Reciprocal graphs can be used in many real life situations. For example, tracking the absorption of alcohol in the blood or looking at how virus’ multiply and develop, the depleting battery life of your phone may also have a reciprocal or exponential function!
You therefore need to be able to read real life graphs. For example this graph roughly models the Ebola outbreak.
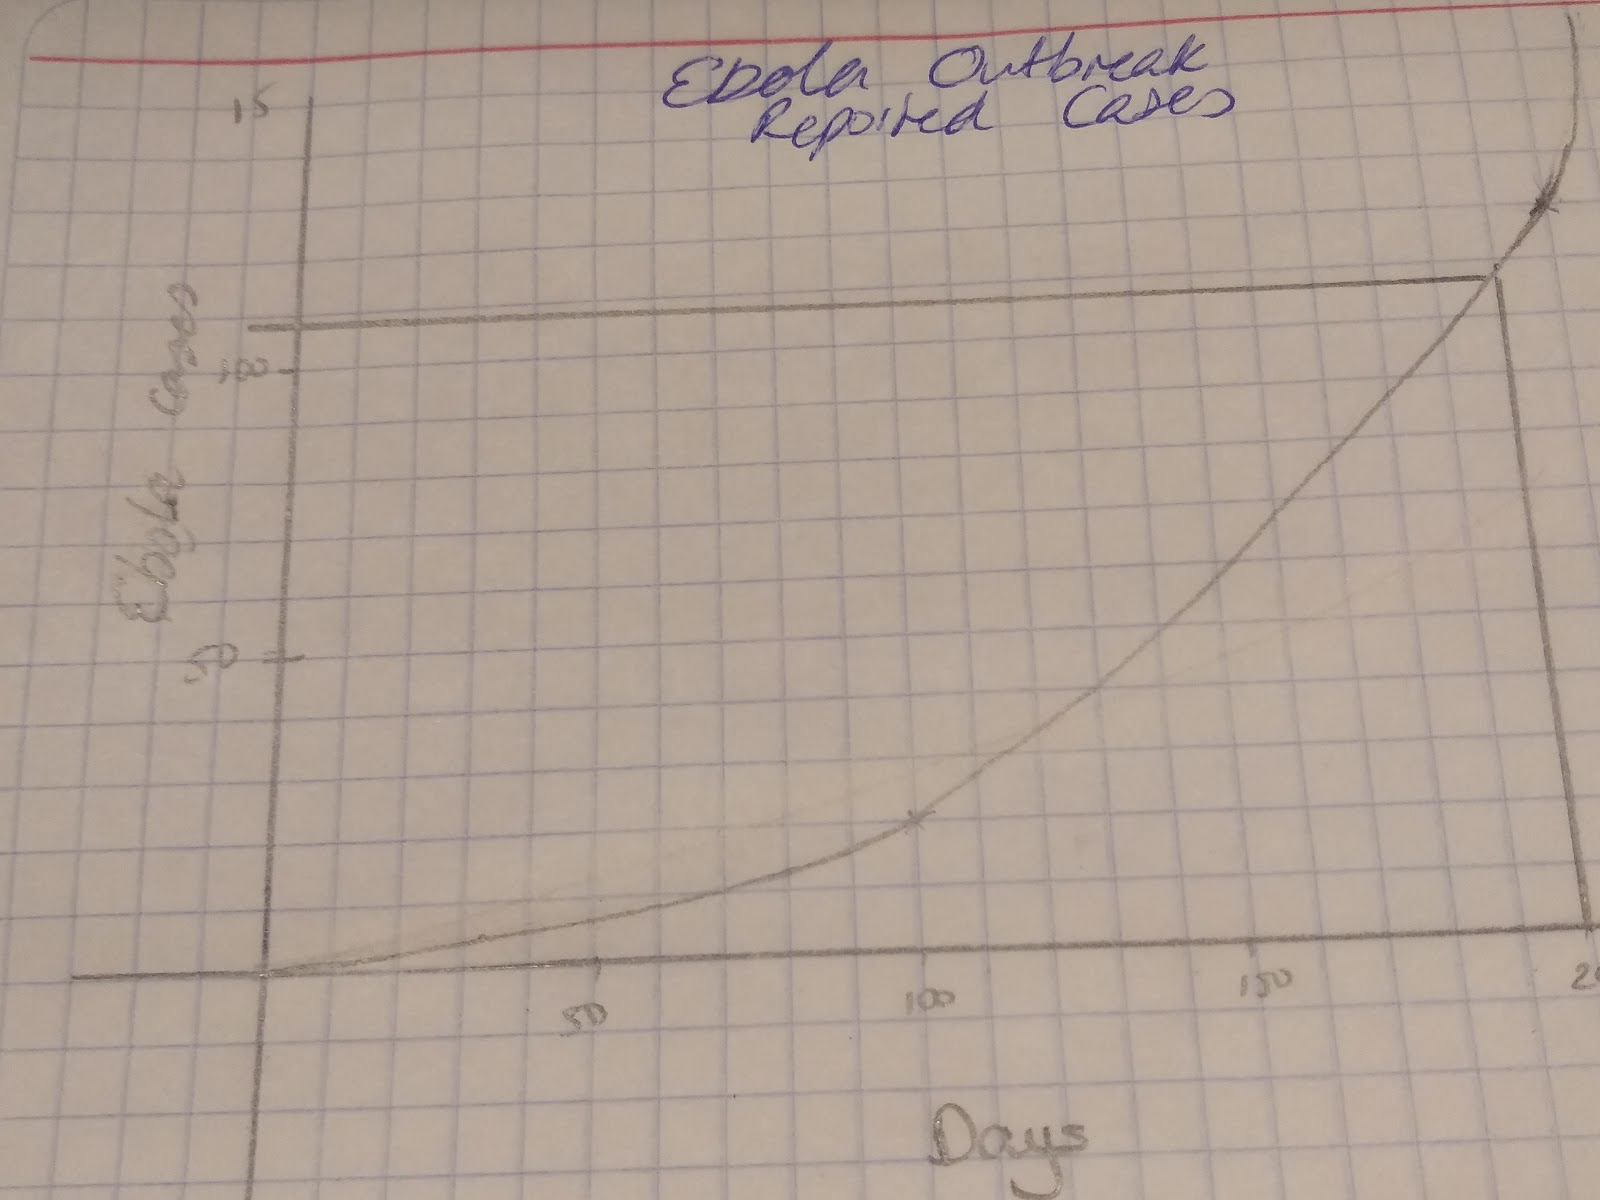
If we want to predict how many cases there will be in 200 days we can use the graph to estimate an answer! Draw a line from 200 days until you reach the graph, then draw a horizontal line across and you can read that there will be about 109 cases of Ebola.