London's Migration
Migration
Most migrants are working age adults between 18-30.
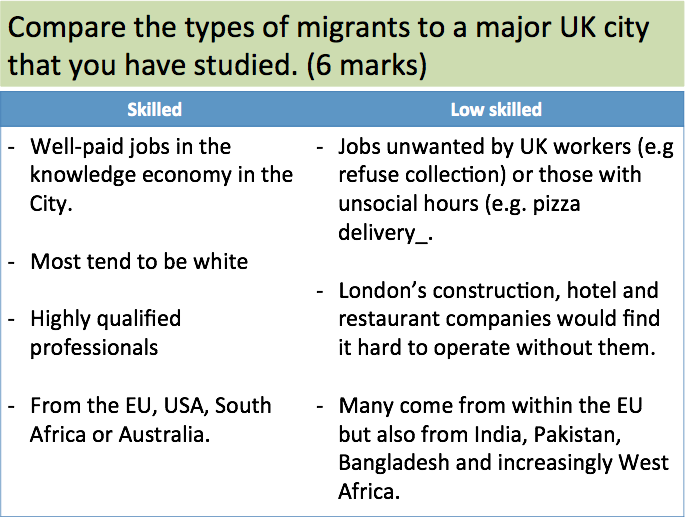
International migration consists of 2 groups of workers: skilled and unskilled.
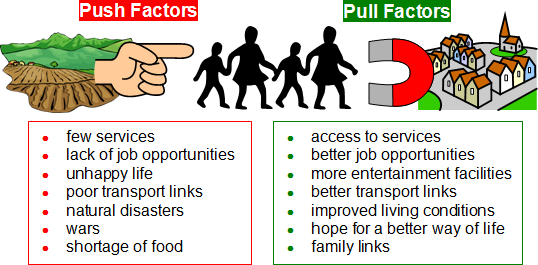
Push and Pull Factors
National and International
London is growing because of national and international migration. Although London is not yet a megacity as it is not home to 10 million people, it is a world city and growing at the fastest rate in its history.
Most migrants are between 21-35 years old. Internal migrants from within the UK tend to be recent graduates from UK Universities seeking work.
International migration consists of 2 groups of workers- skilled and unskilled. Many skilled workers take up high-paid jobs in the knowledge sector. Most migrants in this category tend to be white, highly qualified professionals from the EU, USA, South Africa and Australia.
Unskilled workers also find work easy to get. Many do jobs unwanted by those in the UK (e.g. bin collection) or those with unsocial hours (e.g. childcare, pizza delivery).
Many of these come from the EU but also from Africa, Pakistan and Bangladesh.
International Migrants
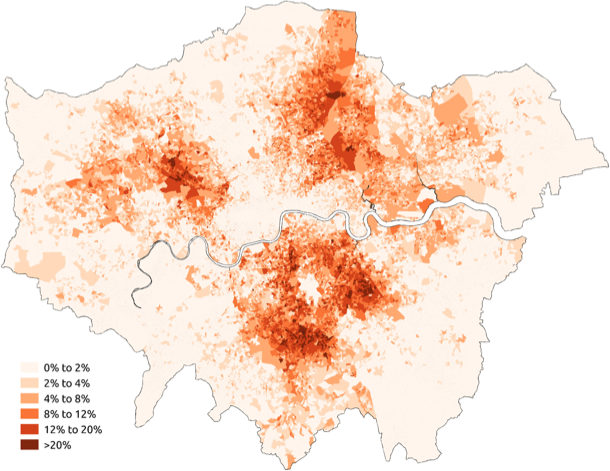
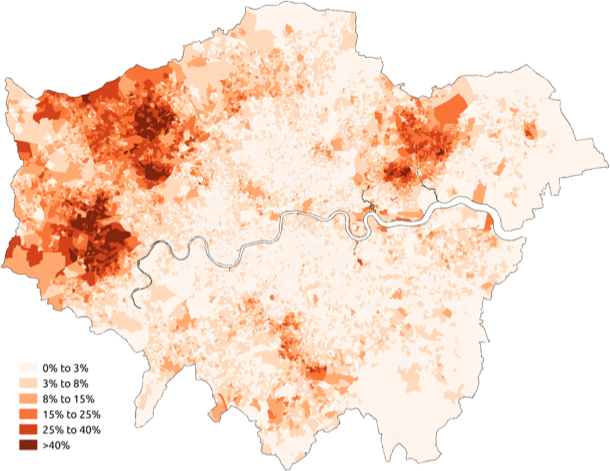
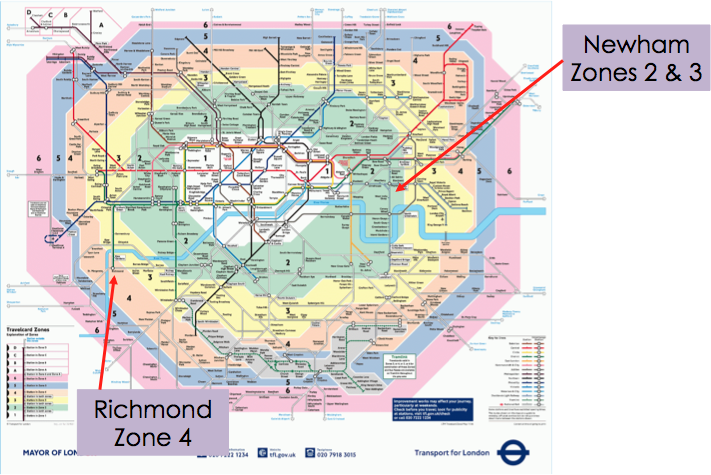
Use the maps to epxlain the migration into London.
Impacts of Migration
Describe and explain the impacts of migration in London
IMD
The government uses quantitative data to find out about different places and the people that live there.
They do this by conducting a Census every 10 years. The next one will be in 2021.
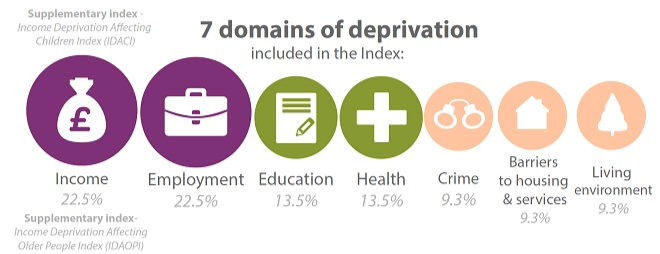
Once they have gathered this data they categorise it using 7 domains to find the most and least deprived areas in the country called the Index of Multiple Deprivation (IMD).
In the IMD, 32844 small areas or neighbourhoods (called lower-layer super output areas, LSOAs) are used, each having 1500 residents or 650 households. 37 indicators are grouped into seven ‘domains’ and ranked by importance; income and employment are higher than health and education. Crime and living environment are weighted the least.
Areas
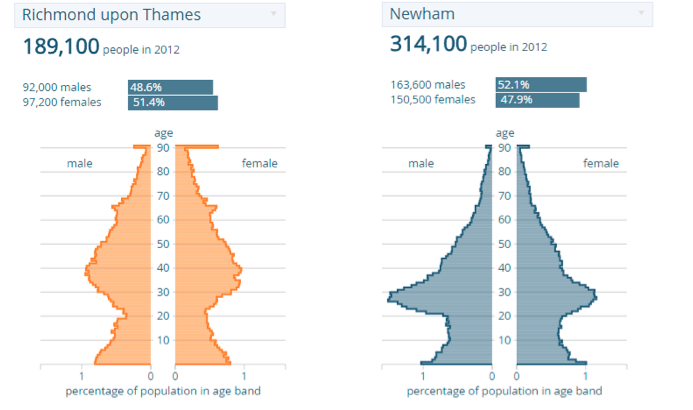
Two contrasting areas of London are Newham and Richmond. To compare we can look at different types of data.
Qualitative data = is descriptive data
e.g. a big house, a large area, a busy high street
Quantitative data = is measurable data
e.g. a house with 5 bedrooms, 2 bathrooms and a 100m garden, a city with a population of more than 1 million people, visitor numbers to Westfield Shopping Centre are 9.1 million per year.
|
| Newham | Richmond | More deprived? |
| General Health | |||
| Infant Mortality | 5.5 | 2.75 | Newham |
| People with a limiting long term illness (%) | 12.3 | 7.6 | Newham |
| Premature deaths (before 65, per 100,000 of the population) | 210 | 121 | Newham |
| Education | |||
| Percentage of students age 16 who did not get 5 A*-C GCSEs in 2012 | 62 | 64 | Richmond |
| % of 19 year olds with no qualifications | 41 | 37 | Newham |
| % of 5 to 16 year olds taking free school meals | 20 | 8.4 | Newham |
| % adults educated to degree level | 26 | 64 | Newham |
The only data which suggest Richmond is more deprived than Newham is the percentage who did not get 5 GCSES.
- Infant mortality is lower- 2.75 compared to 5.5
- The people with a long-term illness is much lower- 7.6 compared to 12.3
- The number of premature deaths is much lower.
- The % on free school meals is much higher in Newham
- The % adults educated to a degree level in much higher in Richmond
- Talk about reasons people leave their homes, and move somewhere else. In terms of London, what different types of migrants are there?
- Your answer should include: Push / Pull / Factors / Skilled / Unskilled / Migrants